S&P 500 Weekly Update: Consolidation Continues; A Market In Search Of Common Sense
by: Fear & Greed Trader
- If you are selling stocks because of an "imagined" trade war, you're making a mistake.
- If you are selling stocks because of the North Korea situation, you're making a bigger mistake.
- This is an anxious market that cringes over every word spoken. It's all noise, stay focused on what matters.
- The long-term bullish market trend remains in place, and that's what we continue to focus on.
- This idea was discussed in more depth with members of my private investing community, The Savvy Investor.
"Common sense is not so common." - Voltaire
Global trade is the issue that market participants talk about most these days. Extremes, that is what makes a story. After all, not much excitement in a statement that says, trade talks continue. But that is what is happening. Instead, we get the journalistic spin that leaves us with the thought of global trade ending next Tuesday at 3 PM eastern standard time.
That is followed by the thought of the financial system being tossed so out of balance, the stock of companies become virtually worthless. When it's stated like that it sounds ridiculous. Perhaps some analysts need to speak to a mirror before they start speaking to the masses.
That brings me to fear, and those who decide to sell that to investors every chance they get. If a regular reader hasn't noticed, these articles usually have an inference to the fact that those marching around spreading fear, need to do so on a different planet. Let me come right out and say the words, they are doing the average investor a great disservice.
That is not saying it's best to keep your head buried in the sand and ignore the issues and other opinions. To the contrary, the message here is always to look at all of the data and keep an open mind.
Yes, the same message, repetitive and boring, I know, but the minute an investor decides they won't manage the equity market that way, they are lost. Anyone that has been invested during this bull market, which at times has been despised, has come to realize it is much better to see what develops first, then act.
Problem is most of these purveyors of pandemonium highlight one data point, then proceed with an opinion. They fail to bring forth ALL of the facts. I leave this segment with the proclamation that the trade war that wasn't, is pure noise. A media fabrication of what is really taking place, wrapped around an agenda. Investors have already witnessed how bringing an agenda to investing is a sure way to commit financial suicide. A skirmish with ongoing negotiations might be a better way to describe what is actually taking place.
Ever notice when a particular stance or opinion becomes the thing to do, it usually doesn't work out that way? Inflation was the number one issue that analysts and money managers were concerned about as we entered into 2018. That was a bullet point mentioned in January:
Inflation is the 'boogeyman' for 2018 - at least that is what everyone is expecting.
That commentary is continuing as we are ready to complete the first half of the year. It isn't only talk, however, it's a strategy. As per Urban Carmel:
79% of fund managers expect higher inflation over the next 12 months; this is near a 14-year high. Commodity allocations are at a six-year high.
He goes on to mention:
In the past, this has corresponded with a fall in U.S. 10-year yields in the months ahead.
The talk of inflation was so overwhelming that while I believed it may be a good idea to add some exposure to sectors that would benefit (i.e., Materials), I cautioned not to go overboard. With any new idea or strategy, wade in slowly. As I noted previously:
A cautionary note. It's not wise to load up on these inflation-assisted groups now.
While we are being told that inflation risks are elevated, that doesn't mean they have to occur to the extent that suggest being wildly overweight these groups. Proceeding slowly by adding some exposure now to these sectors is wise. Then it will be time to assess and reassess as the situation develops.
The reports on PPI, CPI and the Fed's measure of inflation, PCE have pulled back and softened lately. I won't try to predict what may happen to the commodity picture down the road. I can say that it is now looking like a crowded trade with a lot of folks on one side of the boat. The second half of the year may be interesting when we look at what took place entering 2018.

Fund managers entered the year very bullish, that sentiment resulted in a January spurt in the indexes that brought on an overbought situation not seen in quite some time. During that period, cash levels were at four-year lows. Allocations to global equities had risen to the highest level in nearly three years. Bond allocations were at a four-year low. Money managers preferred eurozone equities over their U.S. counterparts. Here is what it looked like:
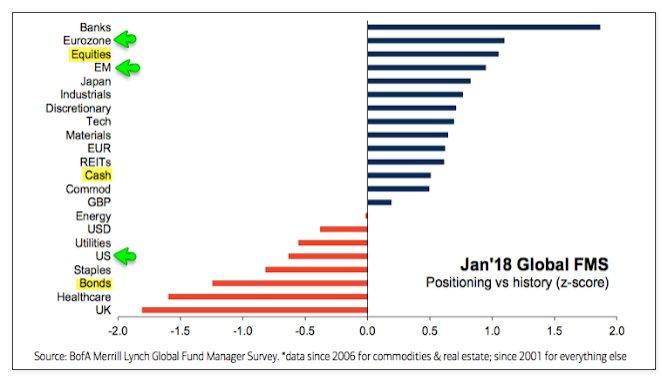
Chart courtesy of Urban Carmel
Hmm, there it was in plain sight again. Everyone was on one side of the boat on multiple fronts, and here is what happened. The stock market corrected, and is now in the midst of a four-month consolidation phase that is working off the excesses created in that buying frenzy.
During this time, global equity allocations have fallen and cash balances have risen. Investors are no longer at a bullish extreme. In the past 9 months, U.S. equities have outperformed Europe by 6% and the rest the world by 5%. Despite this, fund managers continue to be underweight the U.S.
At some point, the out of balance situation regarding U.S. stocks will swing back to a more neutral stance. More evidence to support a view that while there are issues, when we start to gather facts, some of them do lead to a more positive outcome. Keep an open mind.

Economy
Scott Grannis does a great job in explaining what the recent cut in tax rates means for the economy and the deficit. For those that still want to argue that the tax cuts won't generate revenue and be a positive for the overall economy:
The April Treasury report showed that April tax receipts not only set an all-time record, but were fully 12% higher than last April's receipts.
Amazingly, we hear the sound of crickets on that topic now. As per the Boston Consulting Group:
The savings from producing in China have dropped to basically 0%, reflecting higher wages, higher energy prices and a stronger yuan. That's one reason why U.S. domestic capital expenditures (capex) relative to cash flow already have turned up. Combined with corporate tax reform and full expensing, capex in the U.S. should continue to increase, causing productivity growth to accelerate to 1.5% y/y, more than double its average growth rate over the past five years.
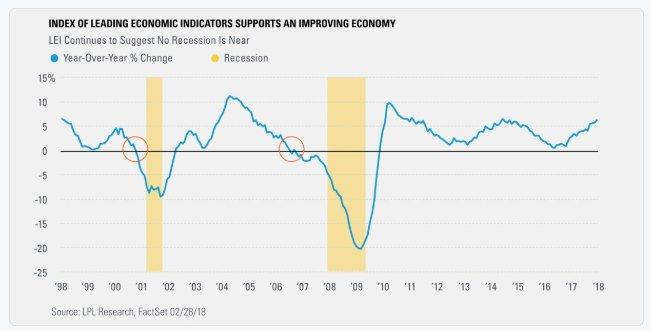
The Leading Economic Index is up +6.4% year over year, the best pace since July 2014. In the past, this will go negative year over year right ahead of a recession. Yet another sign that there is no recession around the next corner.

U.S. Flash PMI Index at 55.7 (54.9 in April), a three-month high. Chris Williamson, chief business economist at IHS Markit, said:
The flash May PMI surveys point to an encouragingly solid pace of economic growth of 2.5- 3% with monthly job gains running at just over 200,000, though the interesting action is coming on the prices front. Input costs measured across both manufacturing and services are rising at the fastest rate for nearly five years, with the goods-producing sector seeing the steepest cost increases for seven years in recent months.
Furthermore, supplier delivery delays, a key forward-indicator of inflationary pressures, have risen to the highest seen in the 11 year survey history. Rising demand has stretched supply chains to the extent that suppliers are increasingly able to demand higher prices. At the same time, higher oil and energy prices are pushing up firms' costs.
Business optimism meanwhile remains at a three-year high, with companies commonly expecting rising demand to help drive business growth, setting the scene for further strong survey results in coming months.

New home sales came in at 662K vs. consensus of 677K, down 1.5% versus an estimate of -2.2%. Inventory is at a 5.4-month supply.

Global Economy

Eurozone Flash Composite PMI rolled in at an 18-month low, with a May reading of 54.1 versus 55.1 in April. Again, as per Williamson:
The May PMI brought yet another set of disappointing survey results, though once again a note of caution is required when interpreting the findings. While prior months have seen various factors such as extreme weather, strikes, illness and the timing of Easter dampen growth, May saw reports of business being adversely affected by an unusually high number of public holidays.
Furthermore, despite the headline PMI dropping to an 18-month low, the survey remains at a level consistent with the eurozone economy growing at a reasonably solid rate of just over 0.4% in the second quarter. Job creation is also continuing to run at an encouragingly robust rate and optimism about the business outlook remains above its long-run average.

Japan Manufacturing PMI declined in May to 52.5, from 53.8 in April, the lowest number since August 2017. As per Joe Hayes, economist at IHS Markit:
Despite the promising upturn in April data, May's flash release erred on the side of disappointment as the headline figure signaled the weakest expansion in manufacturing growth in nine months. Employment growth eased, in line with a weaker accumulation of work backlogs due to softer demand pressures.
That said, new export sales expanded faster amid the recent dollar strength vs. JPY. However, there was further evidence that supply-side constraints may be impacting output potential, as material shortages contributed to the greatest lengthening of delivery times in seven years. Consequently, input prices soared at the fastest pace in 52 months.
It was a mixed bag this week. The U.S. continued to post results that point to a gradual ramp to a 3% GDP number. While one report does not make a trend, the eurozone and Japanese reports have been weaker of late, indicating the economies have at the very least plateaued. Whether we will see more deterioration or a leveling off of the data remains to be seen. It's something to keep an eye on.
Earnings Observations
In the FactSet Research Weekly update for Q1 2018, 97% of the companies in the S&P 500 reported actual results for the quarter. 78% of the S&P 500 companies have reported a positive EPS surprise and 77% have reported a positive sales surprise. If 78% is the final number for the quarter, it will mark the highest percentage since FactSet began tracking this metric in Q3 2008.
Earnings Growth: For Q1 2018, the blended earnings growth rate for the S&P 500 is 24.6%. If 24.6% is the actual growth rate for the quarter, it will mark the highest earnings growth since Q3 2010 (34.0%).
Valuation: The forward 12-month P/E ratio for the S&P 500 is 16.4. This P/E ratio is above the 5-year average (16.2) and above the 10-year average (14.3).

The Political Scene
This week we heard that the trade war was on hold. All I can say is: What trade war are these people talking about? I guess I slept through this event. Funny how folks extrapolate issues to extremes and worst possible outcomes, then believe it to be happening.
When I see a headline like this, I ask again: What trade war? A skirmish with ongoing negotiations might be a better way to describe what's actually taking place. Let's apply some common sense, please.

The Fed and Interest Rates
Highlights from the FOMC minutes were released this week. Fed members expressed a range of views on further policy firming. Minutes from the last Federal Reserve meeting read as follows:
Participants expressed a range of views on the amount of further policy firming that would likely be required over the medium term to achieve the Committee's goals. Participants indicated that the Committee, in making policy decisions over the next few years, should conduct policy with the aim of keeping inflation near its longer-run symmetric objective while sustaining the economic expansion and a strong labor market. Participants agreed that the actual path of the federal funds rate would depend on the economic outlook as informed by incoming.
Inflation temporarily above 2% could be helpful. A few participants commented that recent news on inflation, against a background of continued prospects for a solid pace of economic growth, supported the view that inflation on a 12-month basis would likely move slightly above the Committee's 2 percent objective for a time. It was also noted that a temporary period of inflation modestly above 2 percent would be consistent with the Committee's symmetric inflation objective and could be helpful in anchoring longer-run inflation expectations at a level consistent with that objective.
As per Federated Investors:
Nine of every 10 money managers have only known an environment of secularly declining yields, a downtrend that intersects with 3.25% on the 10-year, with resistance at 3.06%. This is feeding a 'this is it!' mentality. Monetary policy is far from restrictive, European and Japan central banks are still expanding their balance sheets. Current market expectations see the federal funds target rate gradually reaching 3-3.25%, making for a flat curve in 1-1.5 years. Recessions typically don't occur until a year or two after an outright yield-curve inversion (short rates above long rates), with the market rallying in the interim.

There's less than a full month between now and the next FOMC meeting, but no sooner than one meeting passes does the market quickly shift its attention to the next meeting - especially now that we are in the middle of a hiking cycle. The market continues to price three hikes this year as being the most likely (two more).
As expectations for an FOMC rate hike in June remain in place, yields along the U.S. treasury curve have been on the rise with the short end of the curve seeing the biggest increases. The two-year yield is up above 2.5%, while the 10-year yield briefly topped 3% and then pulled back.
Seems as if there's always someone from the Fed giving us his or her thoughts on the economy. Last week, James Bullard gave us his thoughts on interest rates, inflation, and the economy. One comment that got my attention was as follows:
It is unnecessary to press policy rate normalization to the point of inverting the yield curve since inflation and inflation expectations are either at or below target.
Remember how the end of QE was supposed to end the bull market? Surely when the Fed starts winding down its balance sheet that will be the equivalent of tightening and stock ownership won't be the place to be. It's nice to hear those opinions, but here is a fact to now consider. The Fed has reduced its bond holdings by $100 billion since the end of September.
The S&P is up 10%, the Nasdaq +15%.

Sentiment
Urban Carmel recently posted these charts:
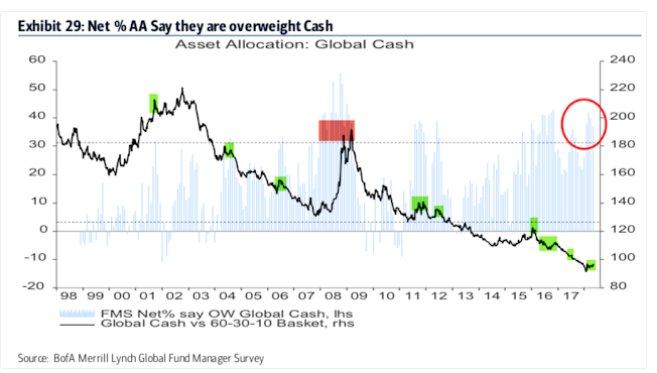
Fund managers are a net +37% overweight cash (+1.4 standard deviations above its long-term mean).
That is something seen at market lows.

Another contrarian sign regarding the global economy. The ongoing trade war commentary and the thought that the U.S. economy is way overdue for a recession is more than likely responsible for the results in the following survey.
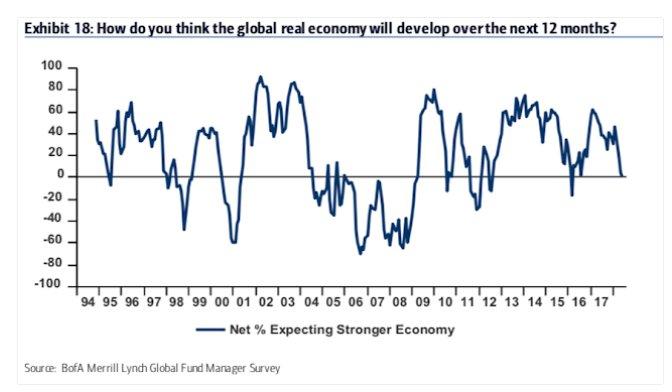
Again, as per Urban Carmel:
Macro expectations have fallen hard in recent months. Only a net 1% expect a better economy in the next year, the lowest since equities bottomed in early 2016, down from a net 47% in January 2018. Investors are now relatively bearish on the global economy.
Individual investors are showing more bullishness than last week. According to the weekly survey from AAII, bullish sentiment increased this week from 36.6% up to 38.5%. That's the third straight weekly increase, and also marks a higher high in bullish sentiment versus the mid-April high. Keeping the report in perspective, bullish sentiment remains well below 50%.

Crude Oil
While higher oil prices also could trim consumer spending, Strategas Research estimates they'd have to average at least $86 for the year to wipe out the tax-cut boost to incomes. With the price of crude oil falling at the end of the week, it appears we won't have to be concerned about $80 oil just yet. The weekly inventory report showed an increase of 5.8 million barrels in the past week. Gasoline inventories also rose by 1.8 million barrels. The oil market saw profit taking this week, as WTI closed at $67.69, down $3.68.

The Technical Picture
Consolidation mode continues with a twist this week. Since the last low that was recorded on May 3, the S&P has made a series of higher highs. The latest was on Monday when the index closed at 2,733. During that trading day, there were 283 new highs compared to just 21 new lows.
We also note that the index closed today at 2,721; back on Feb. 15, the index was 2,731. So, despite what we perceive is taking place with the headlines on any given day, the market is meandering along in what really is a trend less fashion. A typical consolidation pattern.
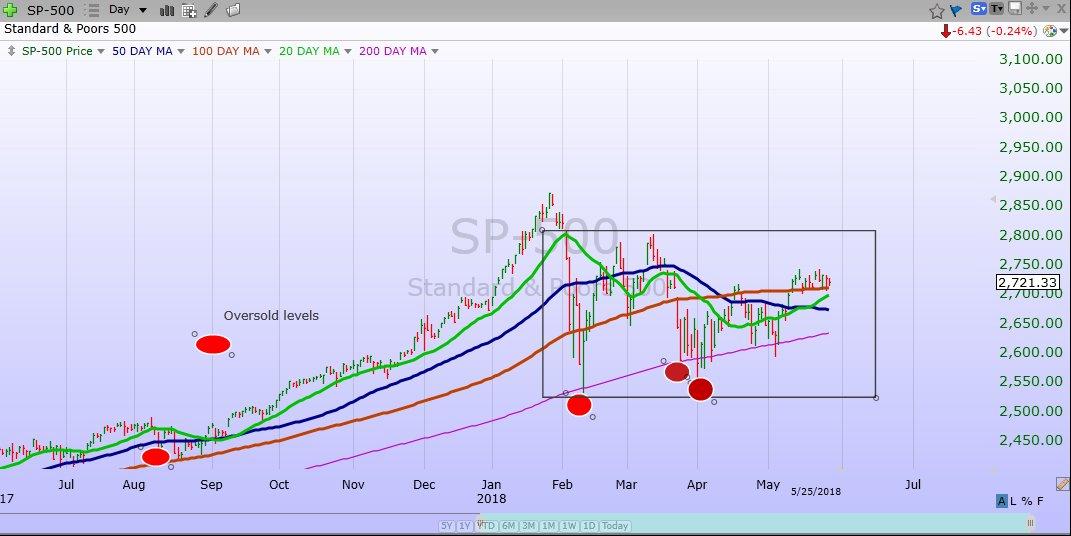
Chart courtesy of FreeStocksCharts.com
The technical picture shows no signs that would cause me concern. Not only do I see that in the S&P 500, I take my cues from the charts of the other major indices as well. The Dow Industrial is also riding along a support level. The Dow Transports, often thought of as a good tell on the economy, just broke above a resistance level that was in place since February.
Add in the fact that the Russell 2000 made a new closing high this week, that tells us that the rally is very broad, and the major indices are in sync. When that happens, it presents a very strong bullish signal.

Individual Stocks and Sectors
Consumer Staples continues as the worst YTD performer. Quite the Opposite for Consumer Disc. (driven by Amazon (NASDAQ:AMZN)). Energy has now taken over as the leader for the year. The Energy sector is up 15+% in Q2. Crude Oil is now up 20+% for the year.
Despite the sell off in energy stocks at the end of the week, I am not inclined to abandon this trade.
Perhaps this is just a pause in what has been a big move higher.

The AP reported that Congress has voted to approve legislation scaling back the Dodd-Frank law, a framework for banks that was put in place to prevent a recurrence of the 2008 financial crisis. The roll back, which was promised by President Donald Trump during his campaign, raises the threshold at which banks are deemed so big and significant to the financial grid that if they were to fail it would cause chaos.
Banks deemed this big are subject to stricter capital and planning requirements and supporters of the legislation sought to ease the restraints on them, arguing it would increase lending and boost the economy. The Financial sector remains undervalued.

As shown below, Technology leads the way with a gain of 9.2% on the year, but the Energy sector is not far behind at this point with a gain of 7.6%. Remember, at the end of the first quarter on March 29th, the Energy sector was down 7% on the year.
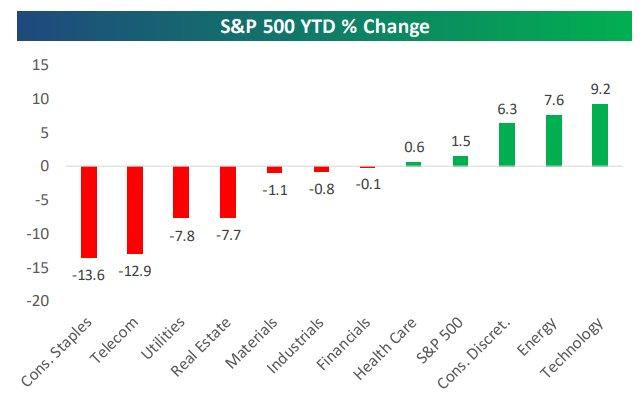
Source: Bespoke
The last two weeks the message has been on diversifying and adding to the sectors that are temporarily out of favor. As I noted last week:
The industrial sector is an area that I believe will be next to get back on track. All that is required is patience as the cyclical sectors should begin to perk up.
Some solid industrial companies were tossed away due to fear over the trade issues. As we have now seen, this trade issue does not have the bite that the associated bark might suggest.

Valuations look attractive, the forward P/E multiple for the S&P 500 sits much closer to its pre-Brexit floor (15.9) than its ceiling (17.4) - and technicals have turned favorable. The triangular pattern in the S&P and Dow has broken to the upside, with the S&P above its 100-day moving average and the cumulative advance/decline line setting a new high, a sign of internal market strength.
Intermediate-term momentum indicators are incrementally turning up, sentiment indicators are oversold after peaking early this year, overall participation is improving across most sectors and the small-cap Russell 2000 index has set fresh 52-week highs.
In addition, the average intra-day range for the S&P has narrowed by roughly half this month to levels historically associated with a low probability of a correction. With no scheduled events prior to mid-June's Fed meeting to disturb this quiet period, the current path of least resistance leads to higher share prices.
Intermediate-term momentum indicators are incrementally turning up, sentiment indicators are oversold after peaking early this year, overall participation is improving across most sectors and the small-cap Russell 2000 index has set fresh 52-week highs. In addition, the average intra-day range for the S&P has narrowed by roughly half this month to levels historically associated with a low probability of a correction.

With no scheduled events prior to the mid-June Fed meeting to disturb this quiet period, the current path of least resistance leads to higher share prices. Following the Fed's meeting, several business surveys indicated activity was off recent peaks last quarter but remains firmly in expansionary territory, whereas the non farm payrolls report showed employers hired 164,000 workers in April, missing expectations but roughly in line after prior months revisions. The report also showed largely in line inflation readings, including data on wage growth.
When I look around and use some common sense, I see underlying earnings and economic fundamentals remain favorable, thus, the market has a reason to find a firm footing at these levels and begin a more favorable upward trend. The level of volatility being experienced over the last several months is actually the type that occurs in a more normal market environment.
The low level of volatility in the several years leading up to 2018 were the abnormal ones.
The probabilities favor an eventual upside breakout from the current trading range. Given the economic and earnings backdrop, pullbacks should be viewed opportunistically.
Investors should continue to make decisions based on their long-term goals. A well-diversified portfolio is designed to allow you to participate in upside potential as well as serve as ballast for any short-term volatility that may arise.
Keep it simple, step back and apply common sense to the agenda ridden noise that persists, and stay the course.
0 comments:
Publicar un comentario