Beware The Inflation Trap
by: Eric Parnell, CFA
Summary
Summary
- Sustained inflation pressures are on the rise.
- Or are they?
- Putting the latest widely accepted mainstream financial media narrative to the test.
- What's really going on.
- Implications for your portfolio and how to capitalize.
- This idea was discussed in more depth with members of my private investing community, The Universal.
It is the mainstream financial media narrative du jour. After years of relatively benign pricing pressures during the post crisis period, we are now entering a phase of sustainably higher inflation.
This notion has raised the specter that the U.S. Federal Reserve will need to raise interest rates more quickly than expected, has sent U.S. Treasury yields higher, and has shaken the U.S. stock market to the core over the past two weeks. But while the narrative certainly makes good sense, a key question remains critically important to ask. Are we really seeing any signs of the rise in inflation that so many have already assumed as given? And what does the true answer to this question mean for our stock and bond allocations?
This notion has raised the specter that the U.S. Federal Reserve will need to raise interest rates more quickly than expected, has sent U.S. Treasury yields higher, and has shaken the U.S. stock market to the core over the past two weeks. But while the narrative certainly makes good sense, a key question remains critically important to ask. Are we really seeing any signs of the rise in inflation that so many have already assumed as given? And what does the true answer to this question mean for our stock and bond allocations?
From The Top
Let’s take this discussion from the top. Here’s how the story goes:
Lower corporate tax rates will be driving a substantial increase in corporate earnings over the coming year, which in turn will feed through to increased economic activity and an acceleration in real GDP growth. Given that the labor market is already tight, this will also bring with it increased wage pressures and will have too much money chasing too few goods in general, thus resulting in sustainably higher inflation pressures going forward. Bond yields will rise as a result, while the ultimate fate for stocks will depend on whether companies can grow earnings to more than compensate for the rise in inflation. Assuming the right companies will be able to do so, favor stocks over bonds in a diversified portfolio strategy, and bias toward growth and cyclical names over defensive allocations within the stock allocation.
This narrative makes completely good sense. And a close monitoring of the news flow from the mainstream financial media provides confirmation for this outlook.
But relying on qualitative confirmation leaves us exposed to the risk of error in our analysis and conclusions. Thus, it is worthwhile to consider the following. Is the underlying quantitative data actually confirming this is the case?
Why is this question important? Because throughout the post crisis period, we have heard that sustainably higher inflationary pressures were looming right around the corner. Yet after nine years, they never actually materialized. In fact, the same narrative was being told throughout the years following the bursting of the technology bubble leading up to the onset of the financial crisis. This included gasoline prices cresting at over $4.10 per gallon in the summer of 2008, which equates to $4.62 per gallon in today’s dollars. Yet sustainably higher inflation pressures never materialized then either. In fact, the exact opposite has been taking place ever since.
Taking A Walk
Corporate Earnings
Let’s take a quantitative walk through the widely accepted narrative outlined above.
We will begin with the increase in corporate earnings. Now over the last three years, annual GAAP earnings on a nominal basis have been flat. After peaking in 2014 Q3, we entered into an earnings recession thanks in large part to the collapse in oil prices. But we have emerged from this earnings recession over the past year and in 2017 Q3 corporations on the S&P 500 Index (SPY) managed to set a new all-time high in annual GAAP earnings at $107.08 per share (the latest reading is still more than -2% below the previous highs on an inflation adjusted basis, but this is a needling observation given as we are likely to clear this hurdle once and for all either in 2017 Q4 or 2018 Q1). So from a realized, in the books perspective, corporate earnings are still effectively no higher today than they were three years ago.
Of course, history is not the story when it comes to corporate earnings. Instead, it is in the forecast, as annual corporate earnings are forecasted to increase at a robust pace over the coming year as the effects of the corporate tax cuts passed by Congress at the end of 2017 increasingly make their way into the numbers. For example, by 2018 Q4, annual GAAP earnings are currently forecasted to be $145.67 per share, which if realized would be a remarkable +40% increase in corporate earnings over the coming year.
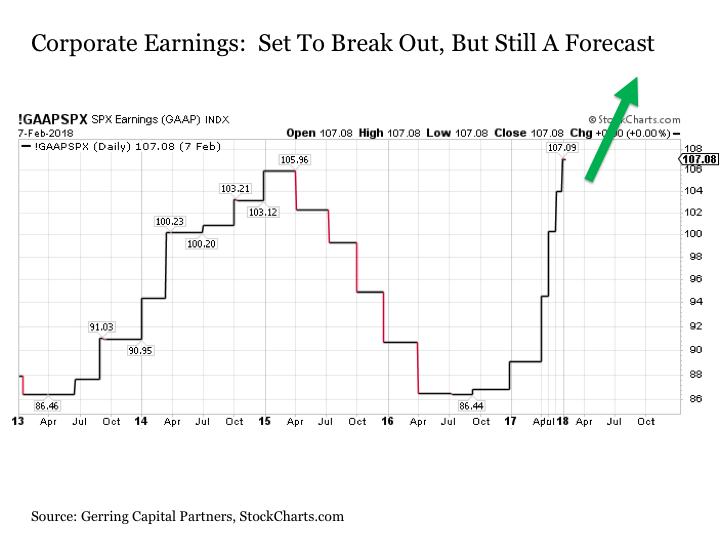
So while trailing corporate earnings over the past few years may not necessarily fit the narrative, the forecasts for the coming year certainly do. The only problem here is that forecasts are predictions and not yet fact. And the possibility remains that corporate earnings could end up coming in well below what is currently being forecasted today. After all, such an outcome certainly would not be unheard of when it comes to corporate earnings. Moreover, the 2018 Q4 earnings season is still a long way away in the future from February 2017 and A LOT can happen between now and then.
GDP Growth
OK. Let’s take the leap and assume corporate earnings growth is going to be robust over the coming year. This strong earnings growth should presumably be working its way through to GDP forecasts. In short, as corporate earnings forecasts accelerate, so too should expectations for expected GDP growth.
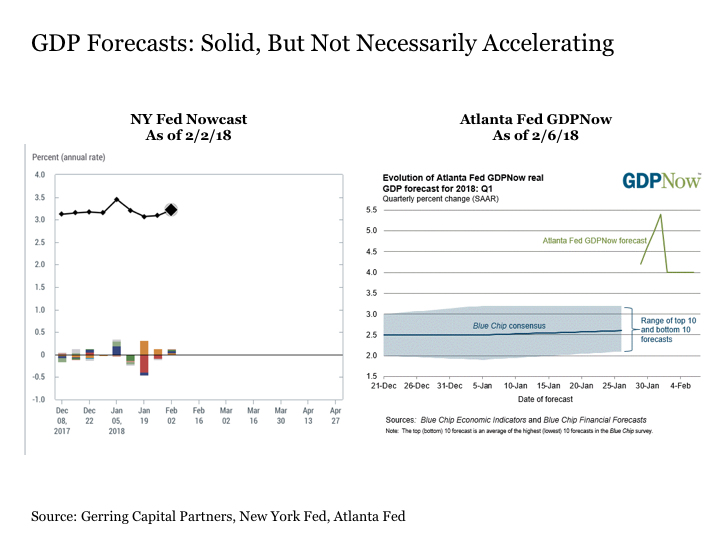
But what is notable that, at least so far, the forecasts for GDP growth remain relatively subdued. Projections for 2018 Q1 from the New York Fed’s Nowcast has not budged since tax cut legislation was officially passed. In fact, it has modestly tailed off in recent weeks. As for the Atlanta Fed’s GDP Now forecast, it popped a few weeks ago but has since faded back lower.
Nonetheless, the GDP growth forecasts in the 3% to 4% range are still solid. But are they sustainable?
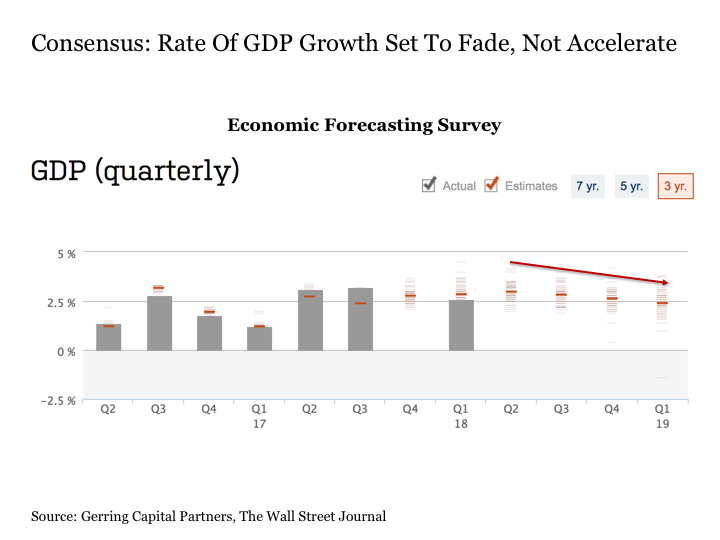
According to the Economic Forecasting Survey from The Wall Street Journal, the consensus view at least to date is that they are not. Derived from a survey of more than 60 economists on more than 10 major economic indicators on a monthly basis, not only is the consensus view for 2018 Q1 coming in below the Fed bank forecasted range currently at a more pedestrian 2.85%, but the forecasts for future GDP growth in coming quarters is for the pace of growth to fade toward the 2.5% range or below, not accelerate. We have had GDP growth running in this range throughout much of the post financial crisis period, and inflationary pressures have largely remained in check throughout.
So on this second point, this feels much less consistent with the mainstream financial media narrative and not so inflationary. But you know what they say about economist predictions, right?
Jobs And Wage Growth
Let’s for the sake of argument take the leap of faith (the antithesis of relying on quantitative proof, of course) that economists are flat wrong on their GDP forecasts and growth actually ends up accelerating instead of fading. This leads to the next question. Does our current place in the economic cycle support such an acceleration? Put more simply, where are all of the workers going to come from to fill the new jobs to increase output and drive the economy higher.
When looking at the current unemployment rate, we see that at 4.1% we are approaching the lowest levels in joblessness in the United States in nearly the last half century. Only once before since 1971 was the unemployment rate lower than it is today, and that was in 2000 at the end of the longest economic expansion in U.S. history. And the last time that the unemployment rate was even close to the current low in May 2007, a recession also soon followed. Thus, the current unemployment rate alone suggests we might be much closer to the end of an economic expansion, not the start of a new acceleration phase. And the onset of recessions are more often than not disinflationary to deflationary, not inflationary.

But wait a second. If the unemployment rate is already low and the high octane juice of corporate tax cuts have just been injected into the economy, couldn’t we see a scenario where already tight labor markets lead to increased wage growth pressures, thus sparking an inflation outbreak. Certainly, but if this were the case, and this was what has indeed been unfolding over the past several months that has contributed the rise in Treasury yields, it is not showing up in any meaningful way in the actual wage growth data. At least not yet.
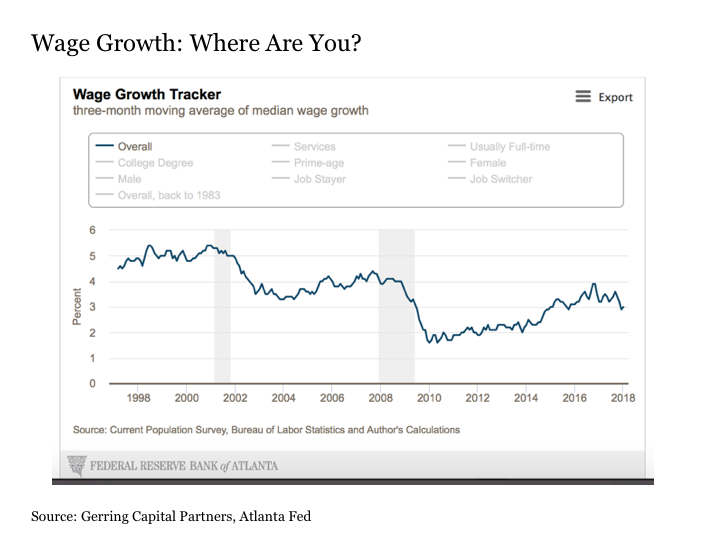
If anything, the current data on jobs and wage growth is less reassuring. For not only, would the unemployment rate have to fall to unprecedentedly low levels over the last half century to keep the economic expansion going, but the wage growth pressures that still remain latent today despite all of the new found economic optimism would finally have to ignite. Perhaps they will, but they have not yet. And perhaps corporates have a machine or two that they might seek to install instead with their next capital budgeting decision. And last I checked, I haven’t seen too much money in the hands of a machine chasing too few goods at the store.
Inflation

So the narrative that we outlined at the beginning of the article is not so cut and dry when taking a walk through the data. But maybe some of these factors do not matter. Maybe we don’t even need GDP growth and wage increases to spark inflationary pressures. After all, the U.S. government is expanding the deficit and the debt like we are already deep in recession, and many of us can still remember the stagflationary 1970s when falling economic growth, rising unemployment, and falling corporate earnings still resulted in higher inflation. Maybe we could be having inflation pressures simply brewing on their own.
With this in mind, let’s just get right to the bottom line and look at the data that would typically be signaling a sustained rise in inflation.
Let’s begin with a headline reading most of us know best, which is the Consumer Price Index from the U.S. Bureau of Labor Statistics. The following chart shows current inflation on a year over year basis.
What we see is that at least through the latest reading from December 2017, the core inflation rate less food and energy is only at 1.76%. This is well below the readings from this time last year when the inflation rate was running at a relatively hotter 2.22%. And it is even further below the recent peak readings over 2.3% in both April 2012 and February 2016.
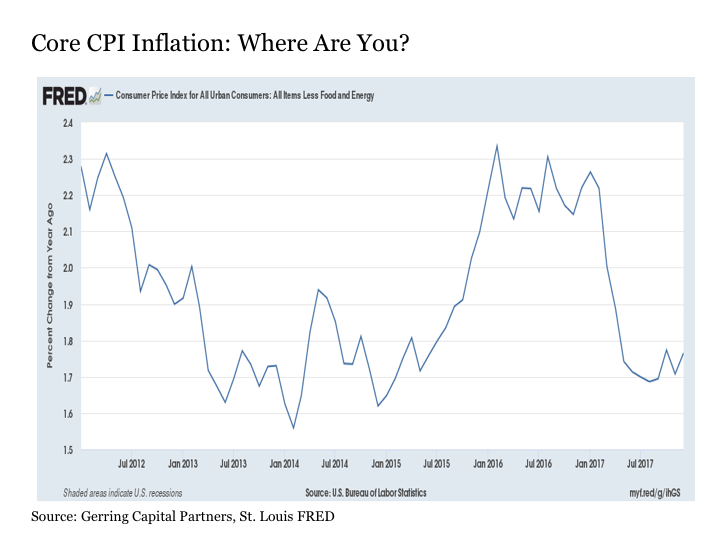
Not a core CPI person? The headline CPI number is telling an even more definitive disinflation trend story. For not only is the current headline number at 2.21% well below the peak readings of less than a year ago at 2.79% in February 2017, but they are still meaningfully below the peak readings of 3.81% back in September 2011.

OK. So inflation is not yet showing up in the headline numbers. But we all know that CPI is a lagging indicator for the economy. After all, by the time inflation shows up in the CPI data, the horse is already out of the barn and galloping down the road from a portfolio management standpoint.
Thus, let’s consider some leading inflation indicators to see if they are showing signs of inflation heating up in the coming months.
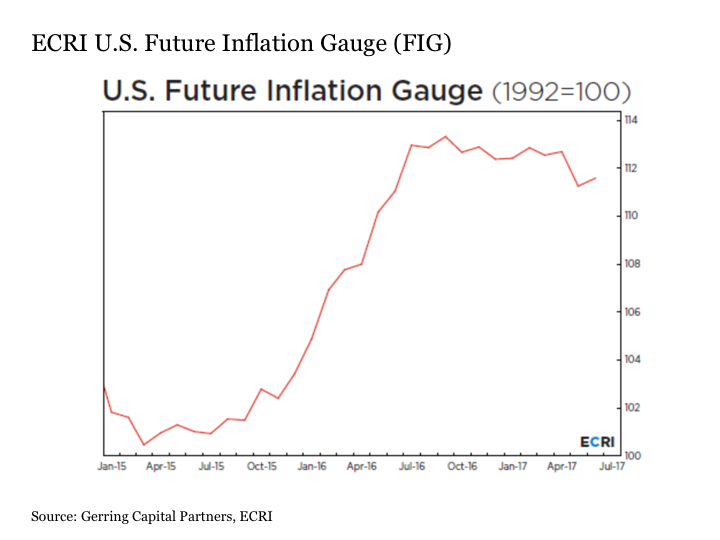
First, we will consider a proprietary indicator from the Economic Cycle Research Institute (ECRI) in the U.S. Future Inflation Gauge. This is an indicator that is designed to move in advance of a change in inflation. Put simply, this reading should be rising well in advance of an increase in actual inflation pressures. So where is this reading at present? After peaking all the way back in 2016, it has been flat to fading ever since. And over the last few months, it actually shrank by -1.5% in December 2017 and -0.2% in January 2018. And while it rose marginally in February 2018, it is still measurably below the readings from nearly two years ago.
OK. But this is a proprietary index that could be subject to error. So let’s just go with the numbers in their simplest form. Lex parsimoniae, right? What are the simplest and straightforward leading inflation indicators telling us?
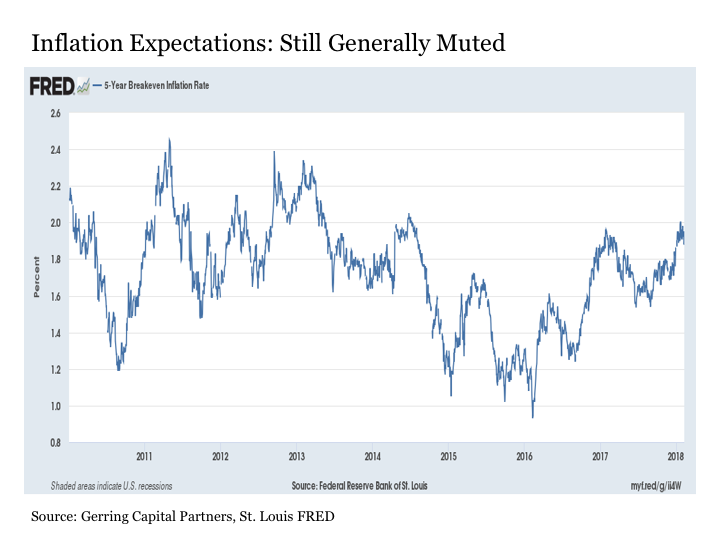
We begin with the five year breakeven inflation rate, which is a measure of expected inflation over the next five years based on Treasury (TLT) data. Yes, inflation expectations have risen since last summer, but they also remain below levels from this same exact time last year.
Moreover, they remain well below the peak inflation expectations from a few years back in the post crisis period from 2011 to 2013. Put simply, if investors are worried about inflation now, they were even more worried about it a year ago, five years ago, and seven years ago versus today. And during past instances of even greater worry, their concerns turned out to be unfounded.
Moreover, they remain well below the peak inflation expectations from a few years back in the post crisis period from 2011 to 2013. Put simply, if investors are worried about inflation now, they were even more worried about it a year ago, five years ago, and seven years ago versus today. And during past instances of even greater worry, their concerns turned out to be unfounded.
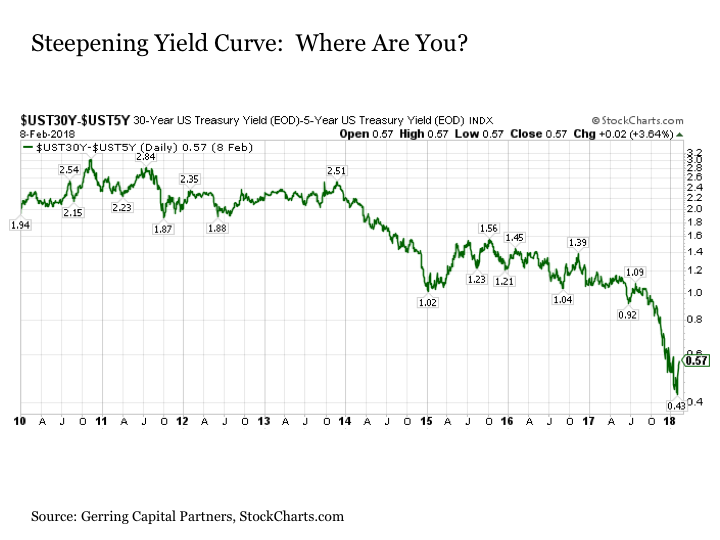
We continue on by taking a look at the yield curve. A common story I have repeatedly heard on the mainstream financial news is that the yield curve has been steepening lately, thus confirming the rising inflation narrative. Sure, it might have steepened a few basis points in recent days, but it is still as flat as a pancake compared to where it was six months ago, a year ago, or five years ago. This alone is definitively disinflationary if not deflationary and certainly not inflationary – after all, why would an investor be willing to accept an increasingly diminishing and generally minimal maturity risk and inflation risk premiums for lending money to the U.S. Treasury for an extra 25 years if they thought a meaningful inflation outbreak was nigh?
High yield bonds (HYG) provide added confirmation to this story. For if inflation was really set to sustainably climb going forward, we would almost certainly be seeing high yield bonds (JNK) getting crushed, as spreads relative to U.S. Treasuries are already at historical tights.
And while high yield bonds have sold off as of late during the recent correction, they are still trading above on an unadjusted price basis versus the levels reached in late 2016 when inflation was also assumed to be right around the corner but never actually materialized.

Commodities prices (DJP) also do not suggest that inflation pressures are building in any meaningful way. Instead, they continue to linger not far above their post crisis lows.
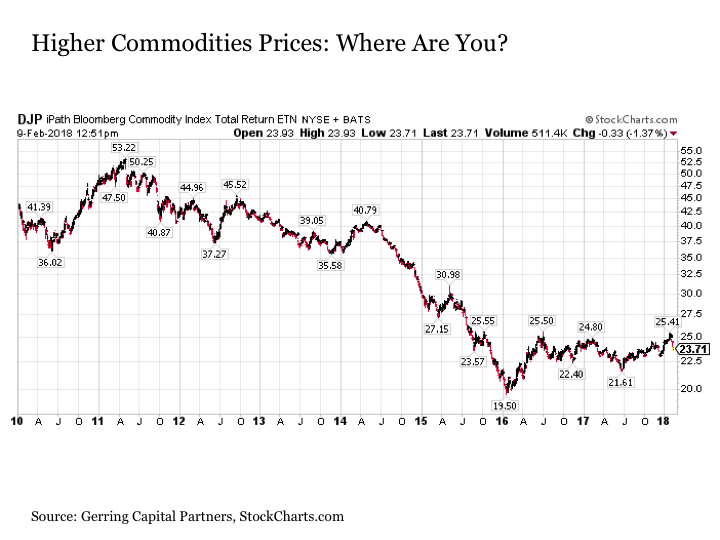
Even copper (JJC) and oil (USO), which have seen solid increases in price over the past two years, are still below the much higher levels from the first half of the decade.
The Bottom Line
Putting this all together, inflation pressures remain largely benign today. And a variety of economic and market indicators suggest that inflation may continue to remain benign and potentially even weaken into the forecast outlook.
It is very possible that we may ultimately see an outbreak of real sustained inflationary pressures going forward. But while the qualitative narrative of why this should be the case certainly makes sense, it is simply still not showing up in the quantitative data in any meaningful way.
So what then explains the steady sharp rise in bond yields in general and U.S. Treasury yields in particular? If it’s not the expected inflation that everyone is assuming, exactly what is it? The likely answer? The same answer it has been every other time in recent history. And the same answer that is likely behind the recent liquidation cycle sweeping through the U.S. stock market. What is this likely answer? One word. China. And this will be the topic of a follow up article on Seeking Alpha on this same topic.
But aren’t investors selling bonds? No. In fact, investors have poured inflows of more than +$60 billion net into bond mutual funds and ETFs since the start of 2018 according to the Investment Company Institute. And if U.S. retail and institutional investors are not selling bonds right now, then such selling is likely coming from faraway lands that own a good chunk of U.S. debt. Such selling influences are not driven by fears of inflation. Instead, they are driven by a variety of other mechanical factors. And they have often proven to be not sustaining over time.
What about the Fed? Won’t the fact that they are raising interest rates cause bond yields to continue to rise? On the short end of the curve, sure. But a variety of other factors other than what the Fed is doing with short-term interest rates are determinants for intermediate-term to long-term bond prices.
And if it turns out that the pace of Fed tightening is faster than the pace of economic growth in the coming quarters, current long-term rates may actually appear attractive at some point in the not too distant future.
What about the Fed’s quantitative tightening (QT)? Doesn’t the fact that the Fed is now selling bonds (BND) from their balance sheet mean that bond yields are going higher? Possibly, but remember that the Fed selling bonds (AGG) is just one market participant in a vast and deep bond marketplace. For as long as the volume of buyers exceeds whatever the Fed has to sell at any given point in time, prices can certainly rise. Do not forget that bond yields consistently rose during all three implementations of quantitative easing (QE) when the Fed was actively buying bonds on a daily basis. Thus, it is not outside of the realm of possibility that bond yields could consistently fall the more the Fed is selling into the marketplace as a result of QT.
If it indeed the case that the rise in bond yields have little to do with inflation expectations and much more to do with spillover effects from China (NYSEARCA:FXI), this implies the following.
First, stay long bonds. This does not mean that you need to overweight or back up the truck in owning bonds. But it also does not mean that you should throw them overboard from your portfolio either. Stay long, strategic and selective with your bond allocations.
Second, remain patient and seek opportunities. The current sell off in bonds is potentially setting up for good buying opportunities. Just recognize that you may be buying these bonds against a steady media narrative wave against this idea. Such is where the best opportunities can be derived, however.
Third, do not overlook related stock market opportunities. Selected quality defensive stocks (NYSEARCA:DIA) with high and growing dividends are trading at increasingly interesting valuations as the current market pullback continues to unfold. These may present some of the best upside opportunities in the years ahead depending on how economic events play out in the coming quarters.
Lastly, look beyond the narratives being put forth by the mainstream financial media as to why asset prices are moving in any given direction on any given trading day. For more often than not, what is actually taking place is something entirely different from what it may seem.
Remain watchful and diligent, avoid becoming dogmatic in any particular view, do your own homework, and formulate your own conclusions as to what is taking place in capital markets at any given point in time. Then act accordingly. For it is through this process that some of the best long-term investment opportunities can be generated.
And when it comes to inflation, beware falling into the inflation trap.
0 comments:
Publicar un comentario