A Warning From Dr Copper
by: Andrew McElroy
- Copper has rallied over 50% from the bear market lows.
- But it looks toppy here for a number of reasons.
- How copper, gold, equities and inflation are configured looks very like the 2000 market top.
- But it looks toppy here for a number of reasons.
- How copper, gold, equities and inflation are configured looks very like the 2000 market top.
Copper (JJC) broke strongly to new 2017 highs in July. The collapse of the Trump trade and reflation themes didn't seem to concern buyers too much.
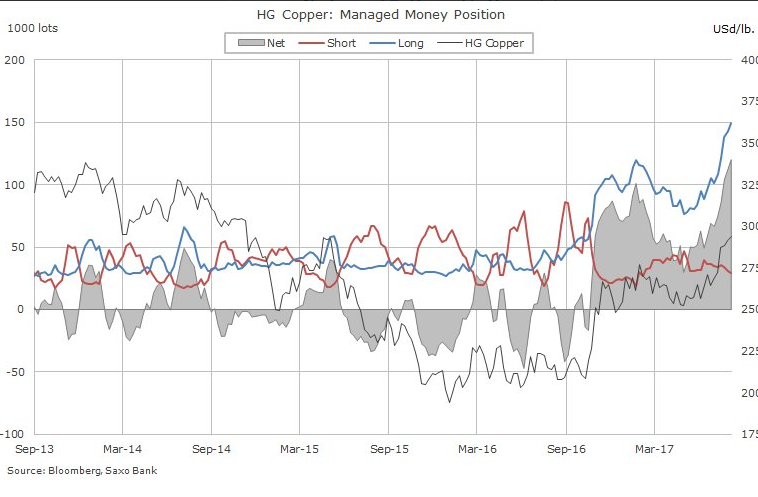
Funds are holding a record net long position.
And this is how price is responding.
So far, so bullish. What could go wrong?
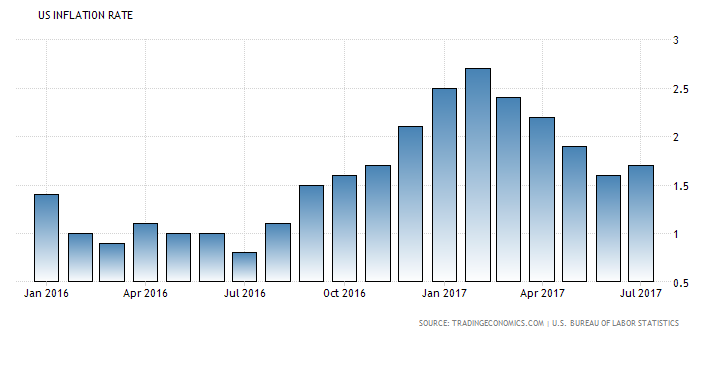
Well actually lots could. As most know, copper is related to growth and inflation, and inflation looks like it has peaked for now, despite the Fed insisting the dip is 'transitory'.
Sure, inflation could turn back up, or copper could just ignore it for a while, but looking back at similar situations suggests otherwise.
The 1999 Comparison
Many analyst have compared the current stock market with the 1999-2000 bubble. Eventually they will be right, but one reason many analysts have been wrong and early is because they didn't look across a variety of markets.
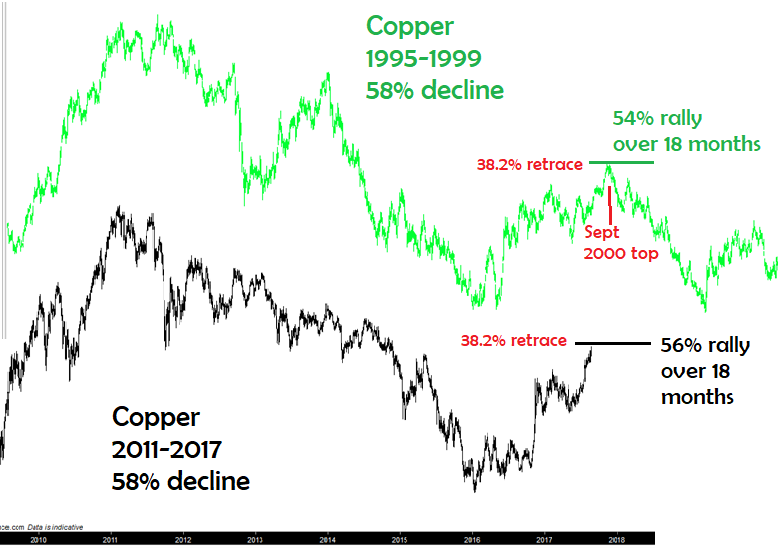
Copper bottomed in 1999 after a significant bear market and made a +50% recovery over the next 18 months into the September 2000 top. Equity bears in 2015 and 2016 would have saved themselves a lot of pain if they had waited for copper to do this again. And now it has.
The reversal and pickup in inflation from 2015-2017 is comparable to 1998-2000 after it reversed a two-year downtrend. However, as the stock market peaked and crashed from 2000-2002, inflation reversed back down again.
Superimposing the inflation rate on copper during both periods, we can see how similar the interactions are in both periods.
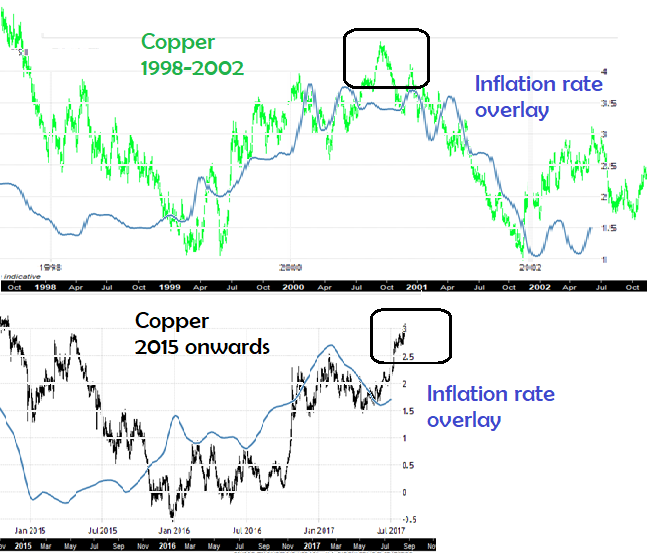
Inflation had already peaked in March 2000 and was turning down as copper made its last rally into the September 2000 top. It may be doing the same now.
The Fed raised four times in 2000 and we can say with hindsight they were much too aggressive. With three hikes in the past nine months and plans for balance sheet reduction, could we say the same of today's Fed with foresight?
Other markets seem in a similar position to 2000. The equity comparison is well known, but gold also fits the period; the way it bottomed and rallied in 2015-2016 is comparable to 1999-2000.
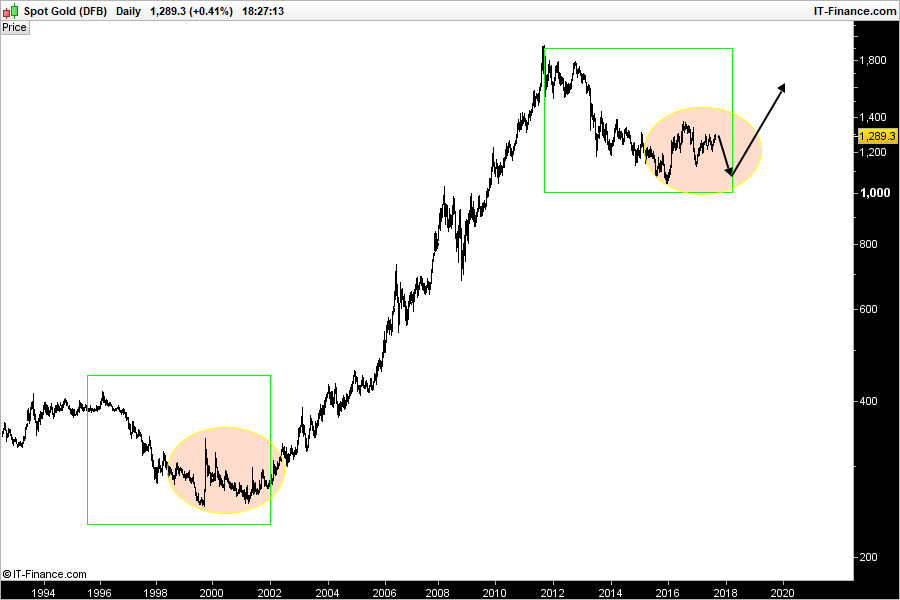
Over the medium term, I see it heading towards the lows again with copper. Many expect gold to shoot higher if equities fall, but history tells us otherwise.
Technicals
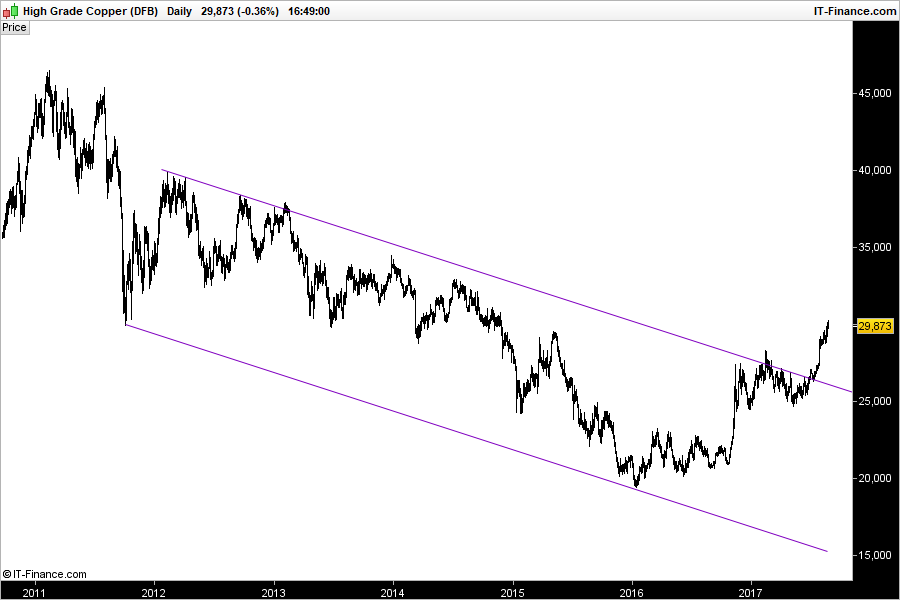
I use Elliott Wave to identify cycles of buying and selling in different markets. Copper looks to be in wave 5 - the last wave - of the current cycle from the lows.
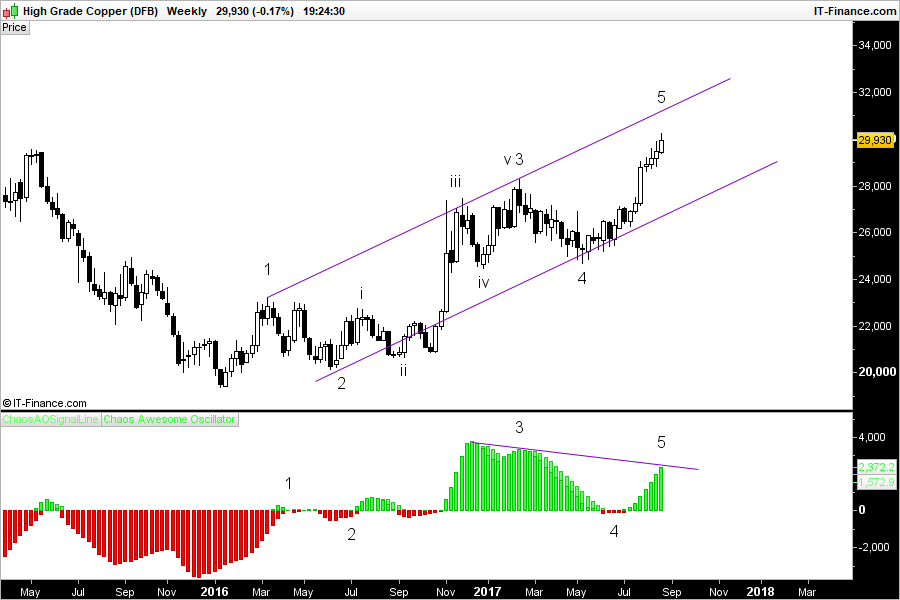
Wave 5 is associated with momentum divergence (which is evident in the lower pane of the chart), as well as deteriorating fundamentals (i.e. inflation falling). Sentiment is the real driver of price and we know from the very first chart how sentiment must be very frothy as positioning is so extreme on the long side.
Once wave 5 is complete, a 61.8% Fibonacci retrace is normal, but I would target the November 2016 pre-election lows of $2.25 if equities start to fall significantly.
I would expect copper to top out around $3.1, near the top of the channel.
Conclusions
Copper has its own fundamentals based on supply and demand, but it is also a valuable piece in the cross-asset puzzle. How copper, gold, equities and inflation are currently configured is very similar to the market top of 2000. This doesn't bode well for any market.
Concentrating on copper alone, the technicals, sentiment, and positioning, plus the decoupling with inflation, suggest that we should be wary of the seemingly bullish move higher. Regardless of any historical comparisons, copper looks to be heading lower over the medium term.
0 comments:
Publicar un comentario