Summary
Development of major Latin American economies.
I will be going through multiple factors such as GDP and education levels.
Argentina is still a mess and Brazil is in a recession, others are doing much better.
A lot has changed between 2000 and 2015. Mostly for the better.
In it, I explained some important steps in behavioral finance (which I already published here), and then I did a detailed study on 6 Latin American countries. These countries were chosen because they represented a clear majority in most areas and had functioning (-ish) stock markets to gather data from. This part was done to understand how these countries have changed since the year 2000 and how they now compare with their more developed North American neighbors the US and Canada.
Lastly, I did the main part of the thesis, which was value investing related data testing to see how Latin and North American markets compare in investing profits and how different simple investing methods performed.
I have kept the text in its original form, even the notes for references are there so readers who are truly interested can go and find that source material here. This information is only one year old so it is still quite accurate and hopefully interesting reading for everyone. I have added new comments to update the situation if seen necessary.
This chapter enlightens the economical situation and history of these eight countries. It is easy to argue against the usefulness of this chapter but it is important because an investor who aims to invest into an emerging economy should be aware of the potential in that country. How that country is doing economically and politically is vital information. As it will be shown, it is very different to invest in Argentina compared to Peru. The countries are in very different situations and present different type of opportunities for businesses. That is why this chapter is added here, so that a reader can gain a strong understanding of the fundamentals of these countries, to understand their potential and difficulties and by all this to make solid investment decisions in North and South America.
These six Latin American countries are chosen because they represent 84% of Latin American GDP and 76% of the Latin American population (Brazil and Mexico being the most populous ones but also having the largest GDP) based on 2012 statistics. When the US and Canada are added to the calculation, then these eight countries cover 96% of 2012 GDP, and 85% of 2012 population compared to all countries in North and South American continents (World Bank Data).
What is also interesting is that Brazil, in terms of GDP, is already clearly bigger than Canada. Though even together these six South American countries don't count even half of the GDP of the US, their population is much larger. Information shown in this chapter is gathered by using different news sources and also economic indicators and statistics such as annual inflation, foreign direct investments, GDP growth rate and corruption. In this chapter, Argentina becomes a common subject of a conversation due to its special situation, which is not shared by any other of the seven countries studied in this thesis.
GDP Related Factors
According to the International Monetary Fund's (IMF) listing, Canada and the US are developed countries and Argentina, Brazil, Chile, Colombia, Mexico, and Peru are emerging countries (IMF 2014a). The Financial Times Stock Exchange (FTSE) is more specific in its listing of these countries: According to the FTSE, Canada and the US are developed countries, Brazil and Mexico are advanced emerging countries, Chile, Colombia and Peru are emerging countries while Argentina is listed as a frontier country (FTSE 2012: 1). At the moment, Argentina risks to be demoted from this group to an even lower standing (FTSE 2014a: 1).
Reasons for this can be seen from FTSE's Quality of Markets Criteria (FTSE 2014b) that shows Argentina failing many listed criteria for an emerging market, such as a free and well-developed equity market.
Annual growth rate of GDP figure uses information by the World Bank for years 2000-2012, and International Monetary Fund's information for years 2014-2014 (IMF 2014b, 14). It shows, like most figures below will, that all countries basically have the same direction, so all these countries are somewhat tied to each other, or to the importance of international trade for them.
What stands out is that Argentina has been experiencing some very challenging times in the early years of this study period and has not been able to fully recover since.
One sign of this is Argentina's blooming black market exchange between Argentina's pesos and US dollars due to strong inflation (The Economist 2014a). As previously mentioned, FTSE currently lists Argentina as a Frontier country, which is in danger of being lowered. Argentina is still having problems due to its earlier default at the start of the 21st century and seems that these problems will continue to follow it for some more years. Also it seems that data from Argentina is not fully trustable as Argentina apparently attempts to appear doing better than it actually does by manipulating its published data (IMF 2014b: page 14, notes 5 & 6.).
(click to enlarge)
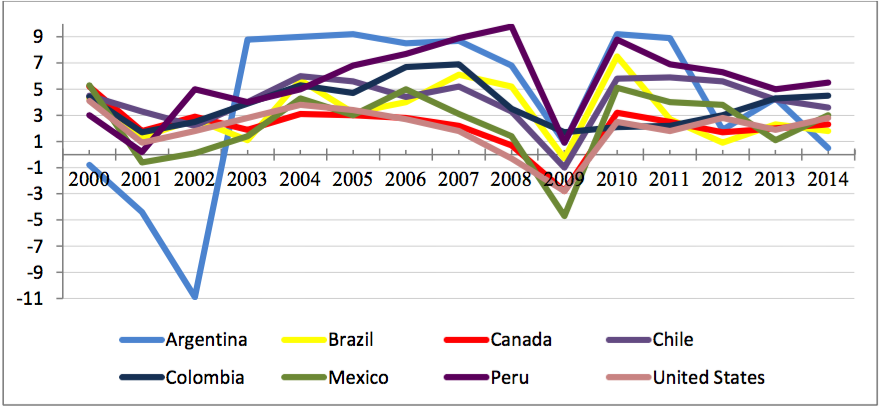
Figure 1. GDP annual growth rate
UPDATE: These figures have been slowly trending down for all except the US. Brazil is actually in a recession, the US is currently reported doing well and performance of all the rest of the countries is trending towards zero.
Debt to GDP Growth between 2000 and 2013 clearly shows Argentina's trouble during the first years of the twenty first century. Since then it seems to have recovered until recently taking a negative direction again. What is expected to be seen here is bigger growth in Latin American countries than in the US or Canada. This is because emerging countries must reach a far greater growth rate in order to eventually catch up with their more developed counterparts.
That is mostly been seen with all of these emerging countries at least at some point during this time line. Brazil's situation is a bit different as it hasn't been able to match up with other economies during the latest years. At least some reasons behind this will be uncovered as more indicators are opened later in this chapter.
What is also interesting is that during 2009, all of these countries experienced smaller growth rates, but it is the North American countries that experienced the hardest drops. This could be due to a strong trade linkage that makes Mexico and Canada very dependent on the US where the latest financial crisis started. Because of this strong tie it can be that Mexico and Canada have been chained to the US growth rate, as they need demand from the US to grow in order for their own productivity to grow as well. The rest of these Latin American countries are more tied to international demand than solely to that of the US.
The graph below shows the development of government debt to GDP. Datastream was the information source for Brazil, and Trading Economics for the rest of the countries. There we again see Argentina's difficult situation over ten years ago that apparently has improved to be comparable with the other countries. Peru and Chile have kept their debt levels extremely low while the US (101.5%) and Canada (89.1%) have distinguished themselves from all others.
(click to enlarge)
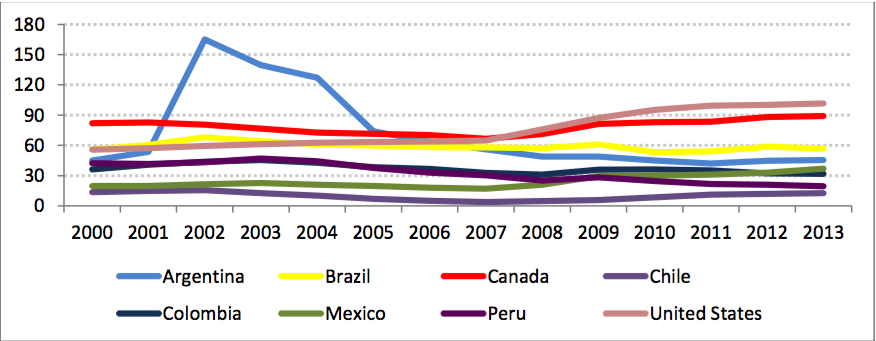
Figure 2. Government debt to GDP %
UPDATE: The current trend is that debt to GDP percentages are growing, but Canada is a positive example where this ratio has gone a bit down.
The difference between Latin American countries and the US and Canada is clear. Mexico has shown the quickest rise in debt compared to other Latin American nations (started on 19.8% and currently is 36.9%), but it's still well below Brazil's 56.8% that has maintained about the same level during the whole period. During this same time, Peru has lowered its debt levels from 42.2% to 19.6% and Chile has managed to stay around the same numbers (2000 13.6%, 2007 3.9%, and 2013 12.8%).
(click to enlarge)

Figure 3. Debt to GDP growth %, 2000 and 2013 compared
Seeing strong GDP growth with low debt percentages is promising, because it shows that growth has not been achieved by debt, but is due to the actual evolvement in business surroundings and international trade. That is a very positive sign for countries' long-term future. This is verified by looking at debt levels of prime examples, Peru and Chile. Since 2010, they have both roughly doubled their amount of debt (Trading Economics) yet, Peru's debt to GDP ratio has decreased and Chile's ratio has only gotten as high as 12.8%. Considering that these countries are only, at best, still considered as emerging countries, we can expect their debts to continue to increase while they continue to develop. This is also likely to happen if in the future their rapid growth starts slowing down, as can be expected from developed countries, and borrowing money becomes needed to reach those final stages of development.
In Figure 3, countries' 2000 and 2013 values of government debt to GDP and GDP growth rate are compared, to better understand the change that has happened. Sources of information are Trading Economics for Government Debt to GDP, and The World Bank for GDP Annual Growth Rate. This provides a slightly different image of how these countries have changed during this time frame. Of course, the GDP growth rate can have quick changes but as the GDP Annual Growth Rate (%) graph above shows, 2000 to 2013 are relatively stable years.
Strong growth of the debt held by the US, compared to other countries becomes clearer now.
Latin American countries are experiencing a good period of growth while the growing budget deficit of Canada and the US keep them far above and also behind other countries. This tells us that so far they haven't been able to benefit off the growth that is happening in the south. As Latin American markets grow, their markets provide more opportunities for western companies that have the funds and knowledge to take their products to these markets that are getting wealthier every year. Importing to these growing markets, instead of just using their economies to manufacture cheap products that are then imported back to the north is a key aspect for the future of developed markets.
What makes Argentina special is that in 2001, it defaulted on its debt and since then it has not been able to be part of the international capital markets. Currently, Argentina's politicians are attempting to fix this situation as on 29th of May 2014. Axel Kicillof, the minister of economy, reached an agreement with a creditor group and Argentina agreed to start paying back its loans to be able to continue borrowing (The Economist 2014b). This situation again had a turn for the worse at the end of July 2014, when another group of bondholders refused to accept any negotiations on the amount of debt and thus forced Argentina to default (BBC 2014a).
Therefore, Argentina's situation can be expected to continue to be difficult for some years. This situation is easily one of the main reasons, which is blocking Argentina's growth.
UPDATE: This situation is practically the same. You can read more about it here.
Population Growth and Education
Below, the left population pyramid represents North America and the right one Latin America and the Caribbean. These population pyramids show the expected population in 2015. When comparing each country, it is clear that the US and Canada have already been having declining population for decades. Mexico's population pyramid looks like the rest of Latin America and it explains why the North American pyramid has as thick of a bottom as it does. In South America, younger generations will be able to support retirees for many more decades, but there might already be change happening as this pyramid is showing signs of narrowing from the bottom. This is important information due to the elderly population presenting tremendous social challenges especially for a poor country.
(click to enlarge)
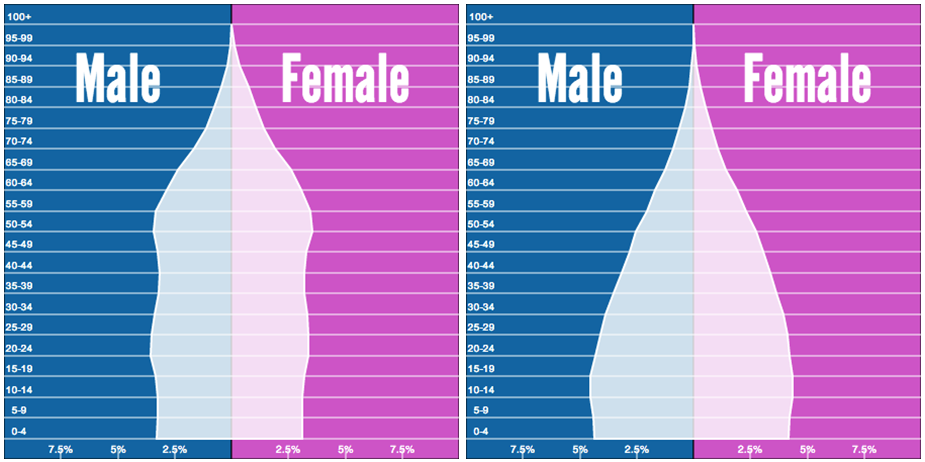
Figure 4. Population growth (Source: Populationpyramid.net).
For population to grow, every woman needs to give birth to minimum of 2.1 children (UN 2013: 1). If a country is under that ratio, it must be considered that it will lead to negative GDP growth in the future as the population diminishes. Most of Latin America is above 2.1 but out of the countries in this thesis, Brazil and Chile are at 1.8 and the US and Canada are not doing much better with 2.0 and 1.7, respectively. The other four countries are between 2.1 and 2.49. The modern trend has been that people have less children, but demographers say this is not certainly a bad thing (The Economist 2014c). Because better educated people are more productive, healthier and also retire later and live longer, therefore, they state that the highest welfare could be reached by fertility rates of 1.5-1.8 (and lower for countries with high immigration).
What is important here is that emerging countries need growing population or at least growing productivity levels to rise up the ladder. Signs are more positive if there are plenty of young population and they are well educated so they are able to be more productive than past generations.
To better understand this I looked at the World Bank Data (from 2012 or latest possible, Brazil had no educational data) to see how much of the population is between 0 and 14 years old and between 15 and 65 years old, as well as gross school enrollment percentages to secondary and tertiary level.
Firstly, the amount of 0-14 year olds supports the population graphs above. By percentages, Peru and Mexico have the largest young populations at 29% (remember that Mexico is one of the largest countries in the Americas). All Latin American countries are above the US and Canada that have 20% and 16%, respectively. There are only minor differences in the next age group as all countries are between 65% and 69%. What jumps out is that Chile is the bottom country of Latin American countries having only 21% of its population under 15 years.
Gross enrollment percentage to secondary school shows all countries being quite even. The US and Canada are at the top but Colombia and Peru are just behind the US and the weakest of the group, Mexico, is only 10% behind the US. Real differences rise up when looking at the gross enrollment percentage to tertiary level after secondary school. Here developed countries place far above the emerging, but out of the emerging Argentina scores the highest with 79%. The next one is Chile with 74%, but then the gap grows wide as the rest place below 50%, with Mexico only having 28% of its secondary school finishers also completing the tertiary education level. This partly helps to explain why Mexico is placed so low when comparing GDP growth levels and as mentioned later, productivity levels. Any country could have huge gains in productivity by providing strong education to their youth, but perhaps Mexico and Argentina are the ones that have the biggest hidden potential in their people.
Mexico with its large, young and most uneducated population has a lot of room for growth, while Argentina has a different potential. Argentina already possesses a quite well educated population but lacks the frame that makes it possible to take advantage of that knowledge and avoid an outflow of brainpower. So in the long term, if future events are positive, and if correct political decisions are made to support change, it is possible to see huge growth numbers in terms of GDP from these two countries.
UPDATE: Considering Argentina's attempts to manipulate some of its numbers, we must remember to be slightly skeptical about all reported numbers. Even when numbers are real, the base under them might be more fragile than we would believe.
0 comments:
Publicar un comentario