Economic data
Funny numbers
America’s GDP statistics are becoming less reliable
.
IN THE coming week government statisticians in America and Britain will release their initial estimates of economic growth for the third quarter of the year. Markets will leap or sag, depending on the news. But investors are wrong to see the releases as a moment of statistical insight; they are merely the first round in a high-stakes game of “pin the tail on the donkey”.
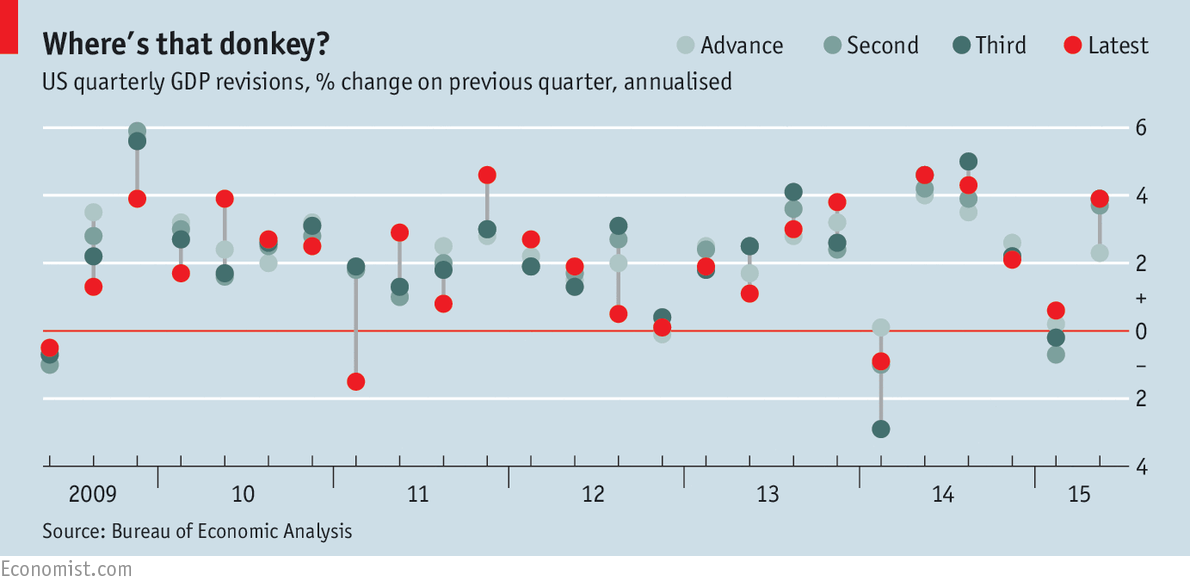
Take January-March last year in America, when an icy winter kept shoppers at home. The intial estimate of GDP growth from the Bureau of Economic Analysis (BEA)—an annualised gain of 0.1%—was disappointing but not disastrous. The second estimate—a decline of 1%—made things looks bleaker. By the time the third and final estimate came in, at -2.9%, it was clear the quarter had been the worst since the depths of the financial crisis (see chart).
Statistics are revised for years, but their relevance soon fades. The BEA recently reviewed its data for 2012-14 and discovered that the American economy had grown more slowly than it had previously thought. At a stroke it removed $70 billion, equivalent to Sri Lanka’s entire output, from its figures. No one noticed. It is changes in the early estimates that move markets and influence policy.
Balancing reliability and timeliness is hard, however. The BEA releases its advance estimate about a month after the quarter has ended. By its own admission, it relies on incomplete data and projections of trends to meet this deadline. The second and third estimates follow at monthly intervals. Other offices operate more slowly: the Australian Bureau of Statistics waits three months before issuing its first numbers and does not release regular revisions.
A recent study by Jorrit Zwijnenburg of the OECD compares the size of GDP revisions for 18 rich countries between 1994 and 2013. It shows that whereas other agencies’ initial estimates were typically too low, the BEA’s tended to be too high. However, the average size of the BEA’s revisions was comfortably mid-table, larger than those in Canada and Spain, but smaller than in Finland, Japan and Norway.
Alarmingly, though, the BEA appears to have become less accurate of late. The average revision from the first to the third estimate was 0.6 percentage points in 1993-2013, but has risen to 1.3 points since the beginning of 2014. That may reflect greater volatility in the economy itself. In the past six quarters growth has bounced around, rising to 3.9% or more three times and falling below zero twice.
There may be other problems too. Between 2010 and 2014, first-quarter GDP averaged just 0.6%, a full two percentage points below the other quarters. The BEA has admitted that it may not have fully allowed for the seasonal effects of holidays and the weather. It has promised a “multi-pronged action plan” to fix the issue.
The BEA is not the only statistical agency mulling changes. In Britain, an independent review of the country’s economic statistics is under way, encompassing both the methodology behind data releases and their scheduling. Delaying releases to improve accuracy would almost certainly result in complaints from businesses and policymakers, however.
An alternative would be to release more data in the hope that the overall picture this provides will be more accurate, if fuzzier. In addition to GDP, for instance, the BEA also publishes figures on gross domestic income. GDI, like GDP, is a broad measure of economic activity, but it tracks income instead of expenditure. GDP and GDI rarely match exactly, as in theory they should: in January-March of this year, America’s GDP fell by 0.2% but GDI rose by 1.9%. The BEA’s solution is to publish an average of GDP and GDI along with the quarterly GDP data.
This average should reduce the influence of errors. It also gives investors another number to pore over.
0 comments:
Publicar un comentario