Contractions In Money Flows And Market Liquidity
by: The Nattering Naybob
Jul. 27, 2015 2:13 AM ET
Summary
- A market inflection point was reached June 22. The subtleties of which may be under appreciated.
- Along with rising risk premia, multiple measures of money flow and market liquidity are in contraction.
- Required banking reserves are in a rapid and major yoy % delta contraction.
- The potential for a commodities "flash crash" in December, coupled with further economic downturn exist.
Speculators and opportunists (short sellers) should see the upcoming seasonal sell-off in the stock market coming.... We're staring down another supposedly inexplicable "flash crash".A date for the market inflection point:
7/22/15 is the next typical seasonal inflection date (where economic activity then begins to wane).On July 1, 2015, ST hints at a Q4 recession:
The current #s indicate a 4th-qtr. recession. There will have to be govt. intervention to prevent it. And that won't happen.And finally nails down a date range for the commodities flash crash:
Commodities could flash crash in Dec. Caveat emptor.We generally take any such advisory with the requisite grain of salt and allow a + or - 2 day latency. Certain SA readers have chided the one who "would be our Fed chairman" about this market "call".
We Nattered that... confronting an IP (inflection point) is one of the biggest challenges that all participants in today's marketplace might face. Recognizing change requires separating the wheat from the chaff and the majors from the minors.
Off the top, between July 20 and 24, the S&P 500 declined 55 points in 5 trading days, from 2132 to 2077. Just a few subtleties from the IP which came to pass... within the last week, many of the fifteen stocks which have been responsible for the bulk of last year's S&P 500 gains, missed, disappointed or issued lowered forward guidance, and were punished. Of the companies reporting, many tech, some large, (AAPL, auto companies, UTX, FCS, LLTC) and mostly those that were punished, in their reports... evidence of a widespread demand reset from China is mounting. We can't buy it and neither can they. Read into that subtlety the consequence that you wish.
Casting a shadow over this and any other subtleties, the underlying criteria pointing to Salmo's advisories... in terms of money flows, a massive contraction in "economic capacity" or potential would seem to be well underway. Coupled with what appear to be signs of nervousness, rising risk premia and eroding market liquidity, this could present issues in fall and winter. We endeavor to elucidate below.
BKLN - a proxy for the S&P LSTA 100 index
(click to enlarge)
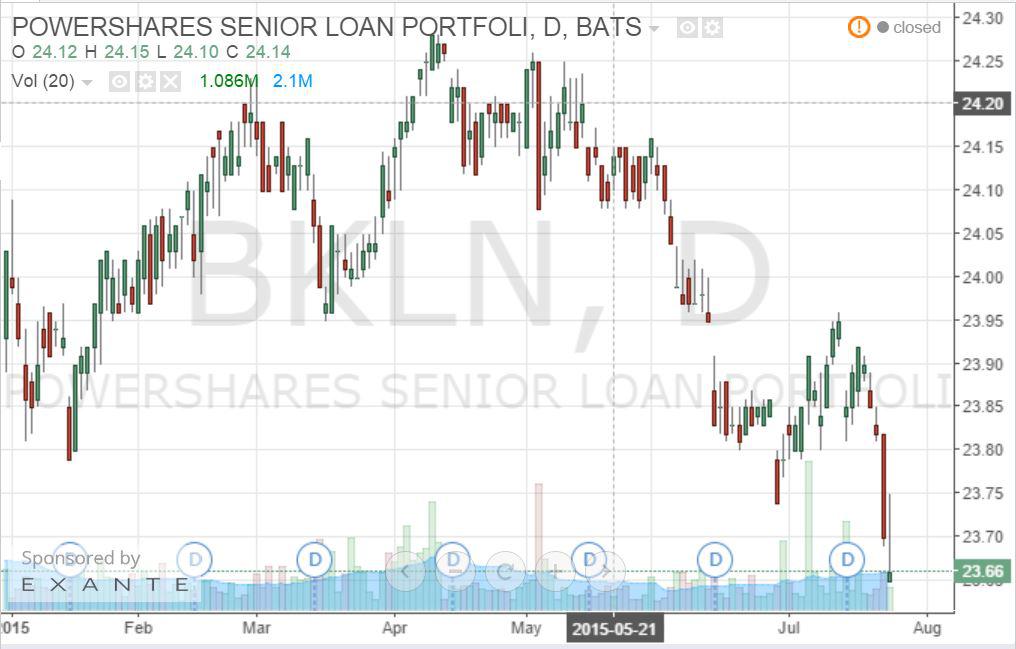
Above note the decline since early April 2015, as margin spreads widen and risk premia increase on the 100 largest and most liquid S&P leveraged loans. Note the action over the last five trading days.
JNK - a proxy for high yield debt
(click to enlarge)
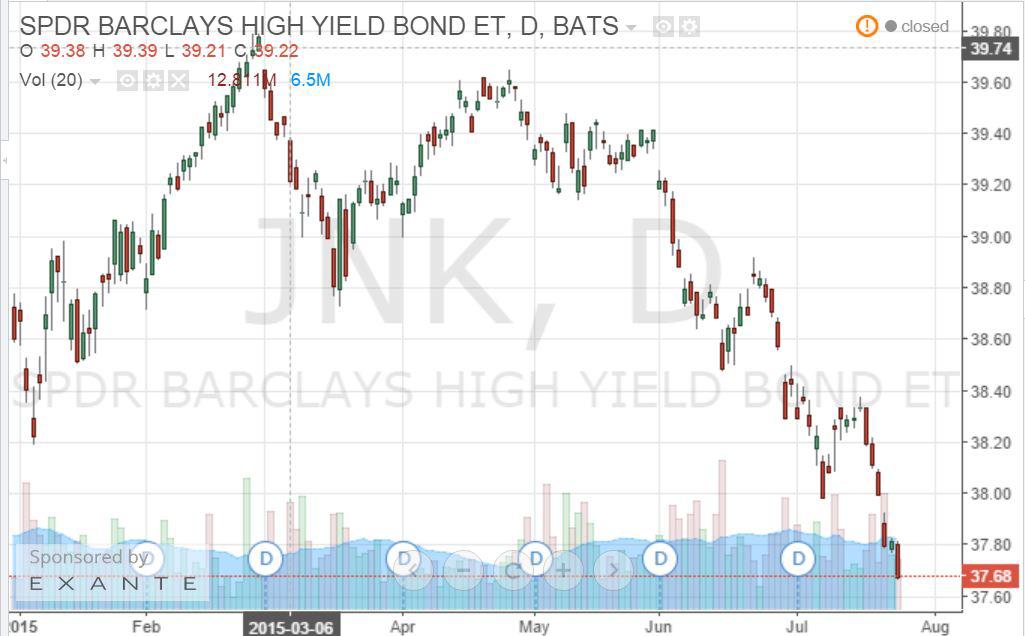
Above note the decline since early March 2015, as margin spreads widen and risk premia increase on the most liquid high yield corporate loans. Note the action over the last five trading days.
5-year and 10-year swap spreads. Rising or widening spreads mean increased risk premiums or nervousness. When the 5-year spread and 10-year spread widen, symptoms of market illiquidity appear.
(click to enlarge)
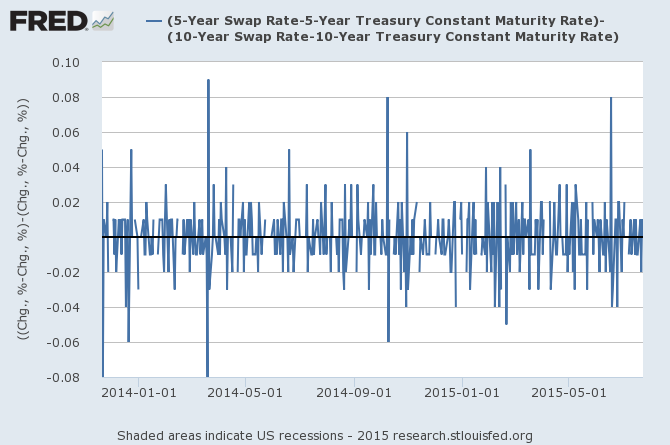
Above, note the spike in % delta for the spread on these dates: March 20, 2014; October 8, 2014; June 17, 2015.
During this same period: 3-month Libor +25%:
(click to enlarge)
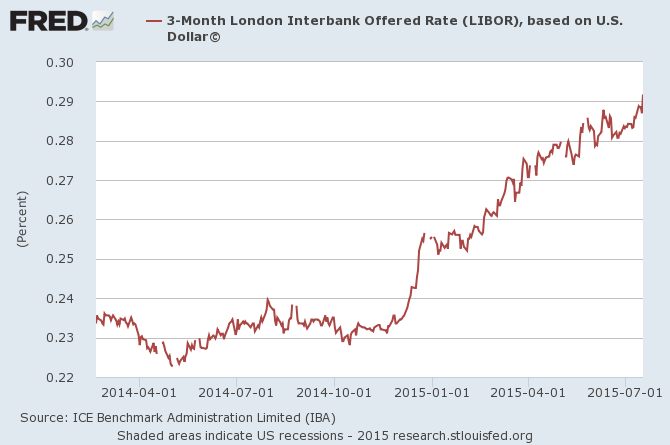
LIBOR is a measure of liquidity as rising LIBOR indicates increased fear premium in interbank lending, which can lead to credit markets seizing up because banks are afraid to loan to each other. At least $350 trillion in derivatives and other financial products are tied to LIBOR, like ARMs.
Rising Libor, rising borrowing costs.
During this same period, 3-month Eurodollar +40% yoy:
(click to enlarge)
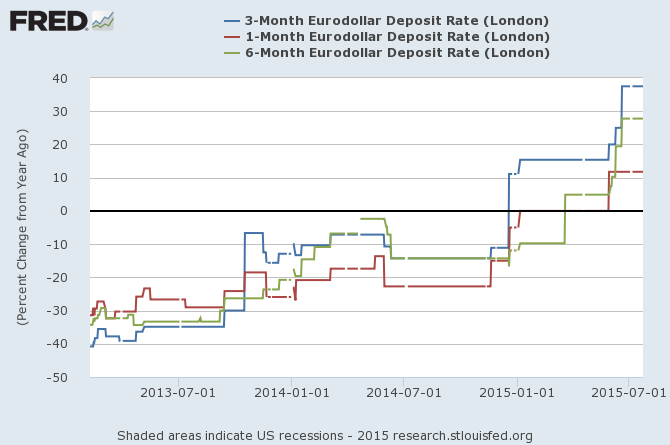
Eurodollars are time deposits denominated in U.S. dollars at banks outside the United States.
Eurodollars are the world's most actively traded futures contracts. Eurodollar futures prices are determined by the market's forecast of the 3-month U.S. dollar LIBOR interest rate expected to prevail on the settlement date. Many banks and large corporations use Eurodollar futures to hedge future interest rate exposure (swaps, etc.).
3-month Eurodollar % change
(click to enlarge)
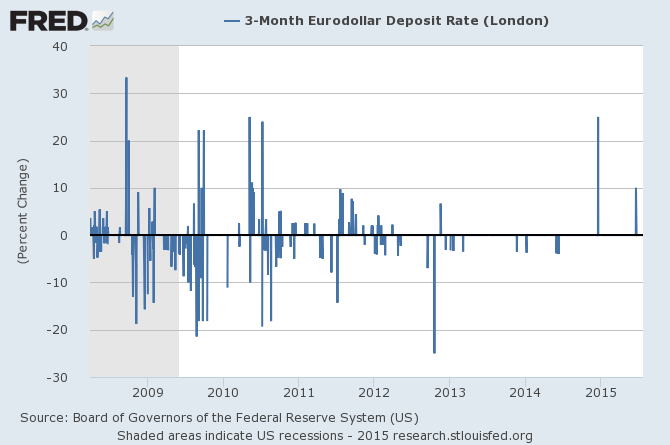
Above note, December 18, 2014 and June 19, 2015, huge % delta spike mid month, quarter end.
Central bank liquidity swaps held by the Fed. Utilized when FOBs (foreign operating banks) are in need of liquidity.
(click to enlarge)
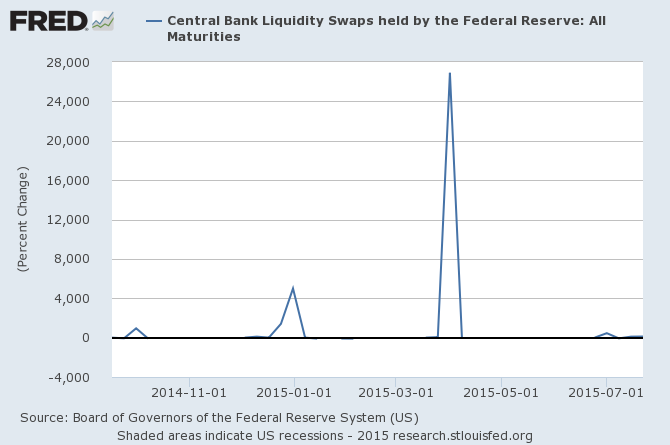
Note above, on quarter open, October 1, 2014, December 31, 2015, and on April 1, 2015, a 26K% delta spike, the largest ever. With notable spikes since quarter open July 1. Go to the chart and play with it.
DTCC Repo Index
The DTCC GCF Repo Index is the only index that tracks the average daily interest rate paid for the most-traded GCF Repo contracts for U.S. Treasury, federal agency and MBS (FNMA, FHLMC).
(click to enlarge)
Above note the spike at March Q1 2015 close.
(click to enlarge)
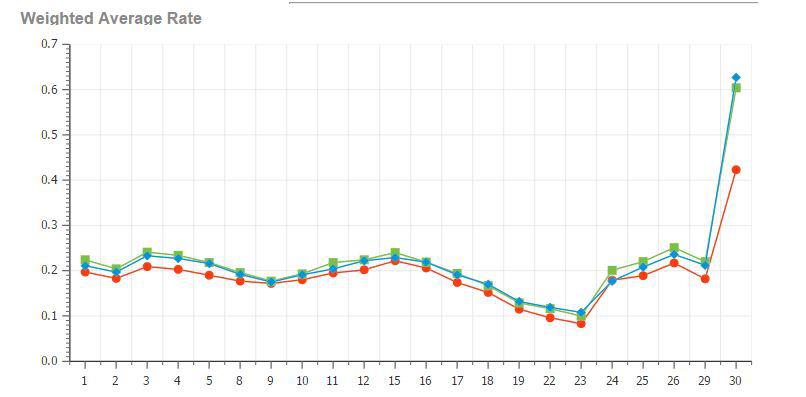
Above note the spike at June Q2 2015 close, will this pattern repeat end of September and December 2015?
(click to enlarge)
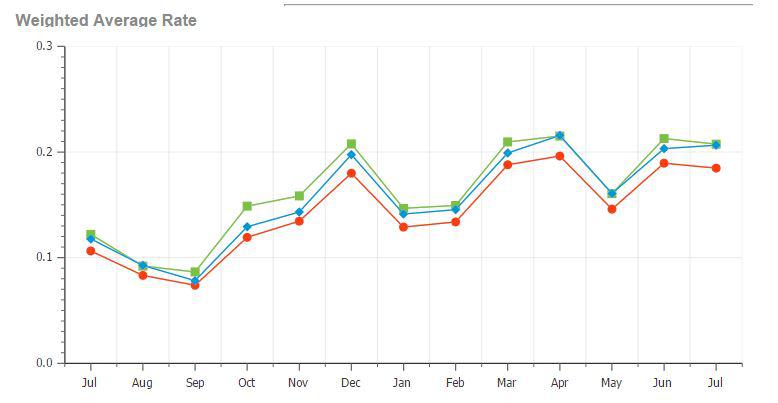
Above note since September 2014, the DTCC Repo indexes for agency, MBS and USTs +100% (doubled).
Under a repurchase agreement, the Federal Reserve (Fed) buys U.S. Treasury securities, U.S. agency securities, or mortgage-backed securities from a primary dealer who agrees to buy them back, typically within one to seven days; a reverse repo is the opposite. Repurchase agreements add reserves to the banking system and then after a specified period of time withdraw them; reverse repos initially drain reserves and later add them back.
(click to enlarge)
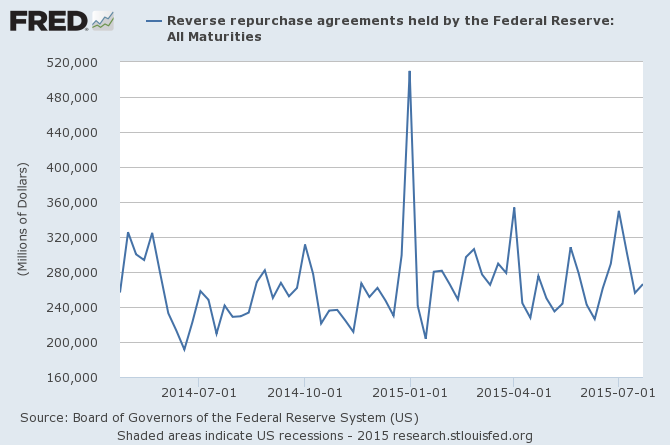
Above note Fed reverse repo spikes in dollar volume quarter end/open: December 31, 2014 (largest ever), April 1, 2015 (2nd largest), July 1, 2015 (3rd largest).
Fed reverse repo from foreign banks and international accounts:
(click to enlarge)
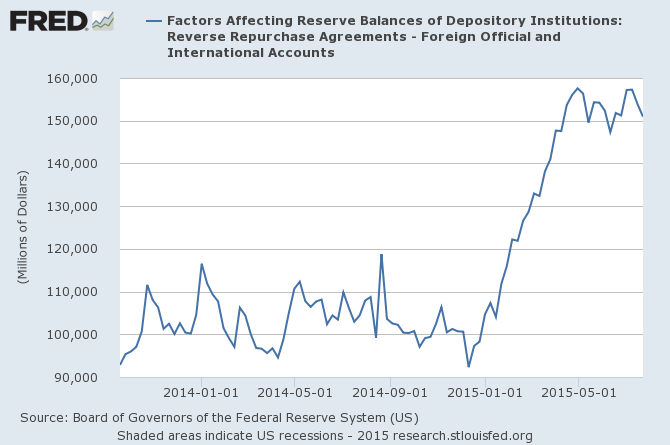
Above note the +77% increase from December 10, 2014 to present.
Reverse Repo by CBs (commercial) and non banks:
(click to enlarge)
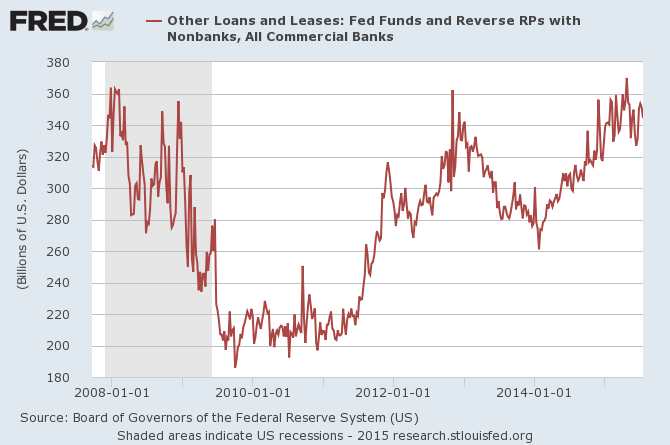
Above note, exceeded the 2008 all time high on April 22, rising 50% since January 2014. What do the above seven charts tell us? Repo rates are increasing, especially at quarter end.
Meanwhile non banks, CBs and FOB banks are engaging in more reverse repo than during the peak of the crisis.
Required Reserves biweekly change in millions:
(click to enlarge)
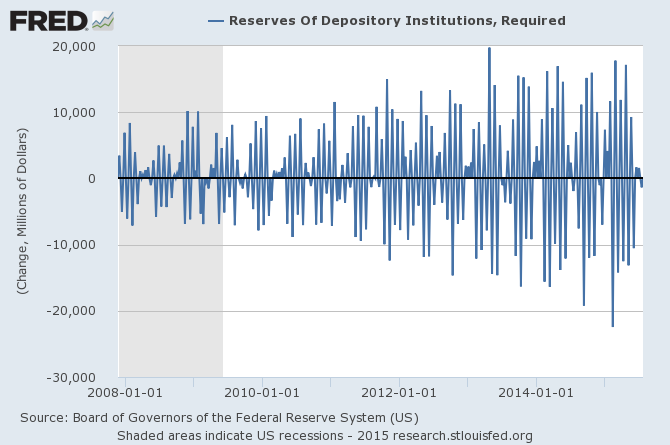
Above note, the predictable and growing undulation since the crisis. All seems well here, yet upon further review...
Required Reserves change from a year ago in millions:
(click to enlarge)
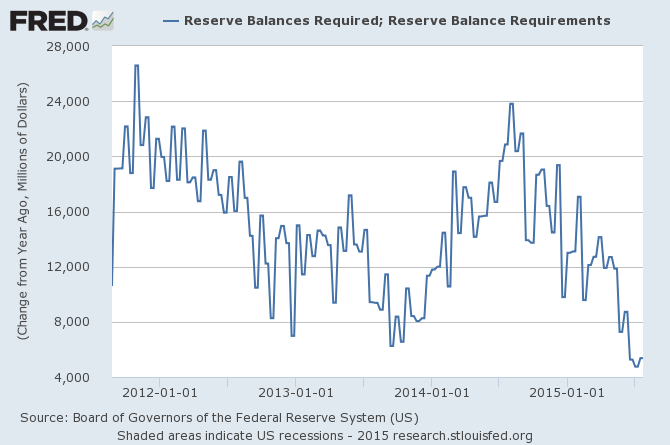
Above note, since November 2, 2011 and August 6, 2014, twin 75% contractions sandwiching a 2014 "rebound".
Salmo Trutta:
I've never seen yoy back-to-back decelerations in money flows (proxy for inflation). QE3 was contractionary. M*Vt fell by 2/3 from January 2013 until December 2014. That kicked oil in the rear. ($120 to under $50/bbl) But that took 2 years. We're going to see M*Vt fall more in 3 months at 2015's 4th qtr. than it did in 2 years.
Required Reserves yoy % delta:
(click to enlarge)
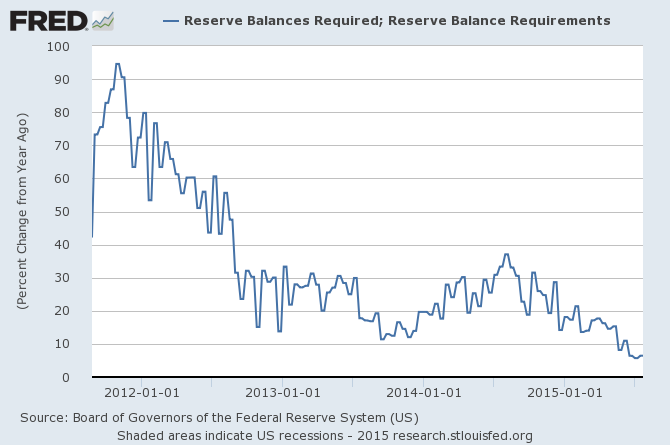
Salmo's above referenced M*Vt drop equates in yoy percentage delta to a 33% to 18% drop in required reserves over 24 months. Above note RR % delta yoy since July 2014, going from 37% to 5% in only 12 months.
To recap, along the fringe of yield seeking, HY, leveraged, junk all with widening margins, rising risk premia. Mainstream, 5- and 10-year UST swap spreads, rising and spiking quarter end. Libor rising, Eurodollar rising, spiking, market contracting. Fed Liquidity Swaps rising and spiking, Repo and reverse repo rising and spiking quarter end for non banks, CBs and FOBs. Required reserves in a major and rapid contraction. These are all measures of money flows and market liquidity, coincidence? We think not.
Have you ever heard the tide going out prior to a tidal wave? That's where we might be right about now. Barring some kind of miraculous August through November surge in economic activity, required reserves or money flows, the November to January seasonal decline will resonate like the silence, just before a massive wave rears its head and forms a curl. We are not predicting the end of the world as we know it, just pointing out subtleties.
0 comments:
Publicar un comentario