May 31, 2015 7:39 AM ET
Summary
- Inflation is sending us a few mixed signals.
- Core CPI shows one thing while the Implicit Price Deflator reveals something quite different.
- Does the Fed move ahead regardless of where inflation may be?
As one would expect, investor opinions differ widely on what the Fed will do or even should do.
Some investors would argue that the economy is not ready to support a higher interest rate environment. Others would remind us that the stronger US dollar has created a problem for all of the internationally diversified companies who have reported some very disappointing results for the first quarter. And of course, because longer-term interest rates around the world remain at historical lows, long-term rates in the U.S. may not perform the way the Fed would like to see. What's more? There are many investors out there (including us) who simply wish the Fed would just get us off of the zero bound rate policy. We're no longer in a crisis, nor are we in a recession. There is modest growth in the economy, and it makes no sense to remain with the 0- bound interest rate policy.
While all of the debating continues on, we believe that there is also some confusion about what the level of inflation really is at this point. Aside from the usual skeptics who claim that the traditional inflation metrics are deeply flawed, recent data seems to be sending some mixed signals between the three primary measures of inflation.
Figure 1 - Headline CPI Inflation
(click to enlarge)
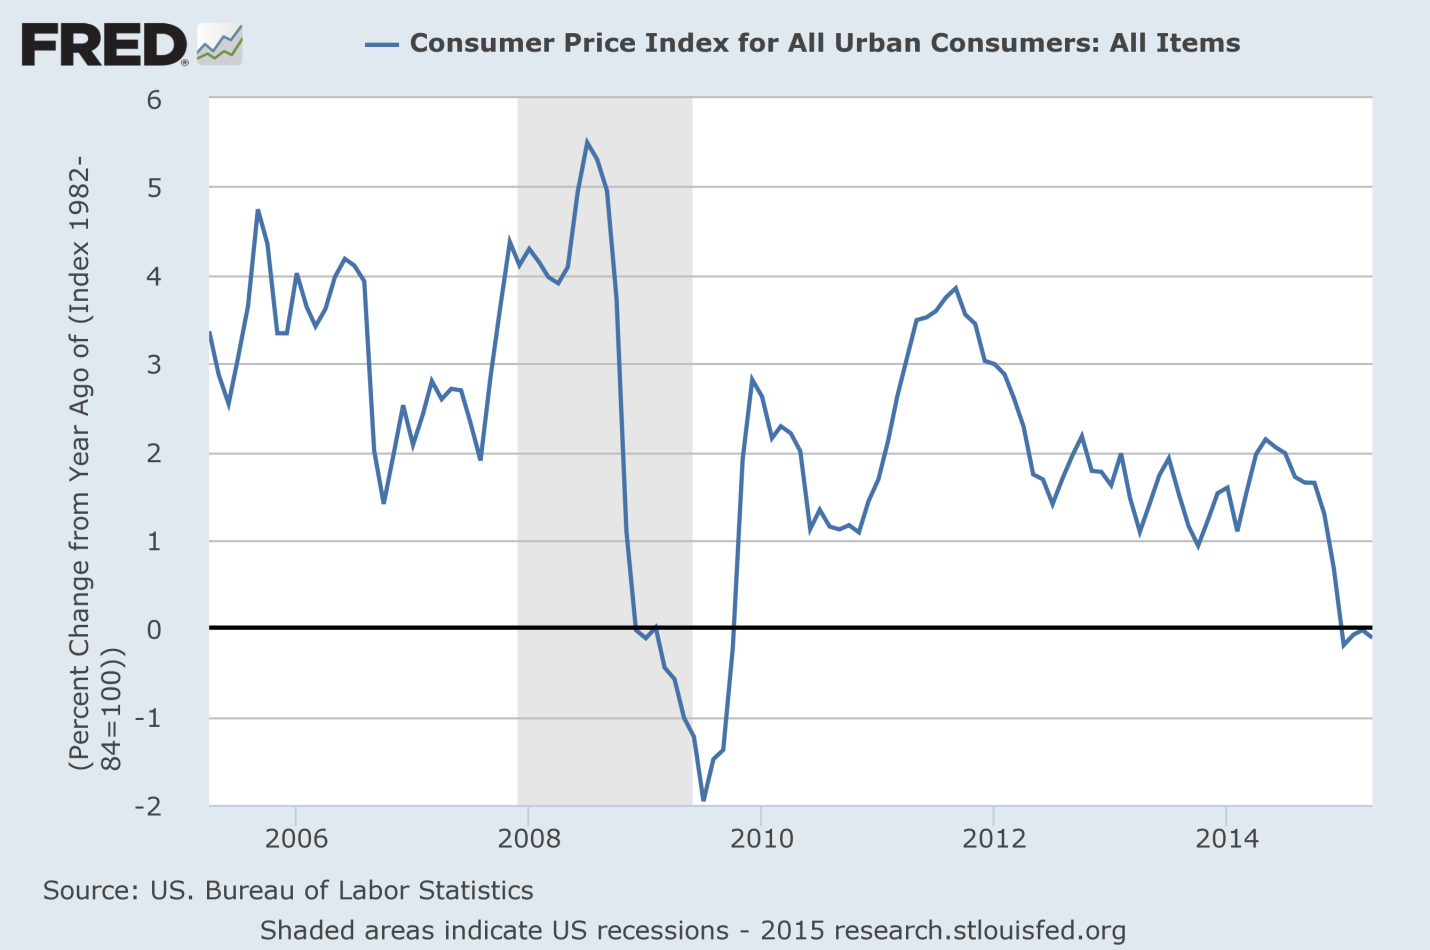
The headline numbers for the Consumer Price Index have always been treated like an "orphan" index. It contains all of the factors which economists at the Bureau of Labor Statistics believe to be the most relevant, and the weightings of the various components are designed to reflect the appropriate mix of consumer spending habits. Indeed, housing accounts for the largest weighting at 41.4% of the index.
Transportation and Food, meanwhile, represent 16.4% and 13.9%, respectively. We also note that total energy use represents 9.0% of the total CPI weightings including 5% for motor fuels and 4% for home energy expenditures. What's more? Both of these weightings are incorporated in the housing segment. Overall, we think it's a pretty fair representation of the typical consumer's monthly budget, and therefore, headline CPI inflation deserves to be monitored as closely as any other inflation barometer.
The catch here is that food and energy prices (which account for nearly 23% of the CPI) are far more volatile than the other 77% of the CPI. As a result, investors have been conditioned to ignore the headline number even though it contains some very useful information. Indeed, 0^ inflation for the past four months seems quite relevant to us.
Figure 2 - Core CPI Inflation
(click to enlarge)
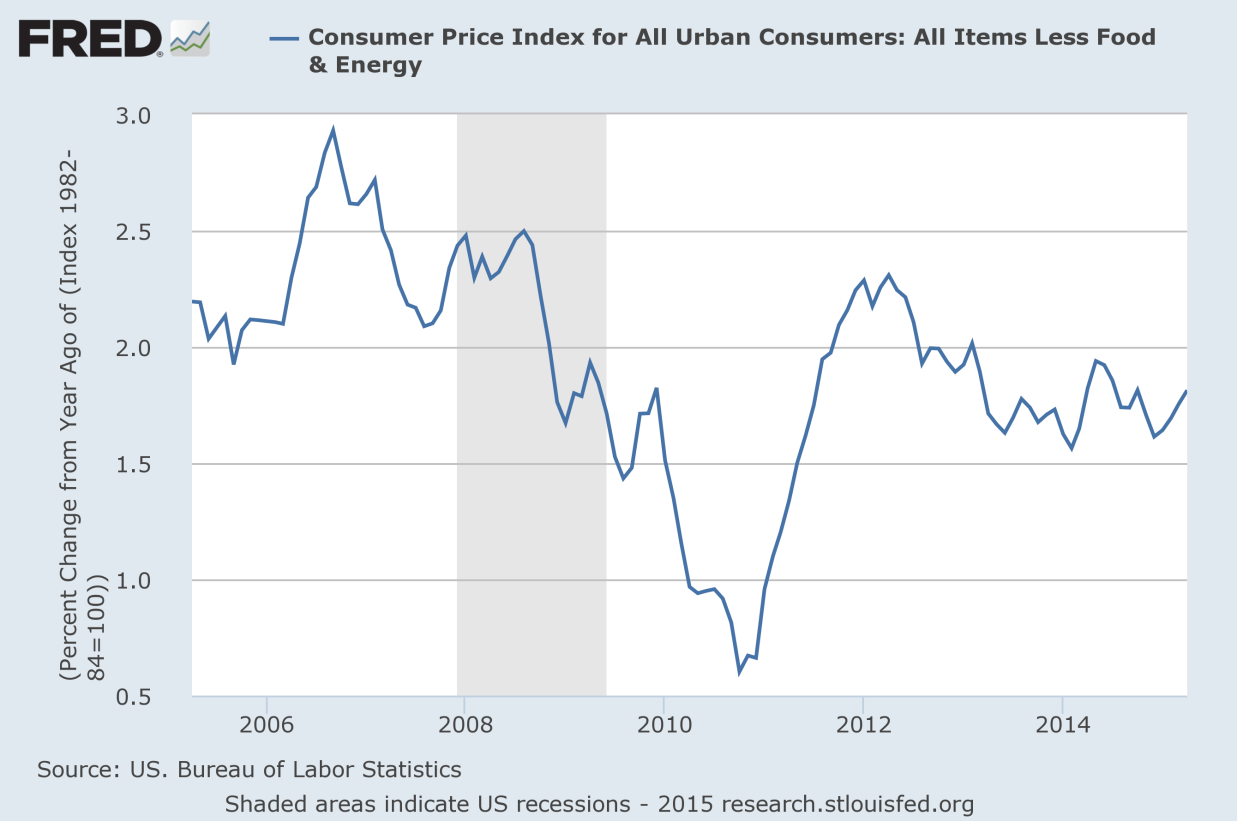
Within the investor class, the Core CPI represents the most widely followed measure of inflation.
Because the BLS also likes to exclude the volatile food and energy components, we get to see a more stable picture of inflation trends. Whether this is a more accurate representation of price inflation is a matter of debate. Many investors, in fact, are sharply critical of this particular index. They argue that Core CPI is a perfectly acceptable measure of inflation as long as you don't need to eat, drive a car or heat your home. Nevertheless, most people rely on the Core CPI and generally accept its various shortcomings.
If we look closely at the last 12 to 18 months of data, there seems to be a stabilization of sorts in and around 1.6% to 1.8%. However, there is little to suggest that Core CPI is on its way to 2%.
If Core CPI was the Fed's primary measure of inflation, then we would start handicapping the odds for a hike in Fed Funds for later this year. However, as the Fed constantly reminds us, they are data driven. So naturally, the Fed looks at every inflation indicator that it can find.
Figure 3 - The Implicit Price Deflator
(click to enlarge)
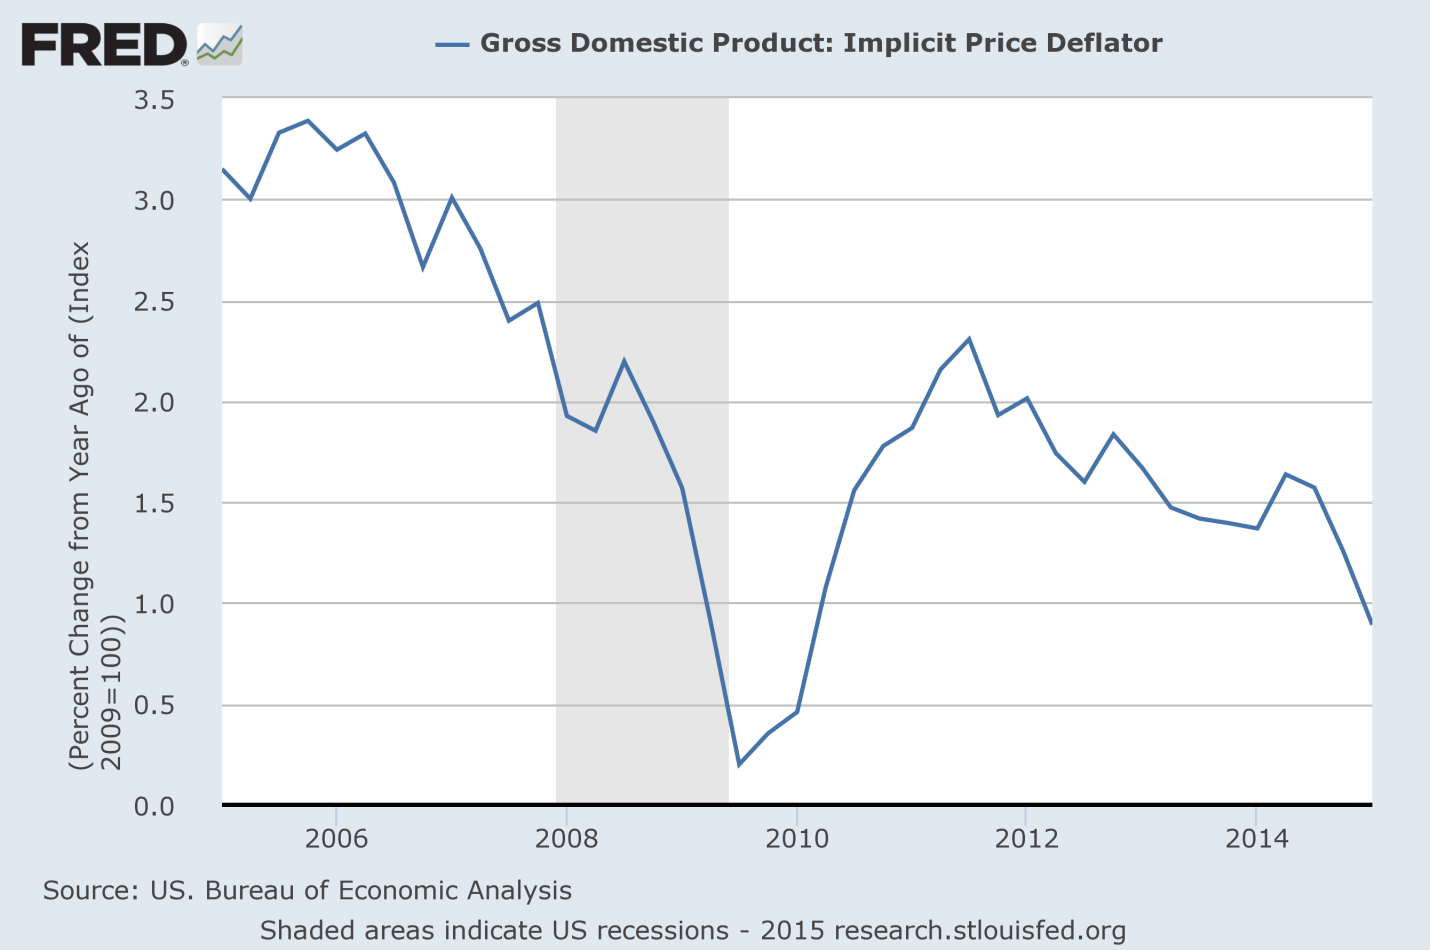
While most investors continue to track the Core CPI as if it were the only inflation indicator that matters, the Fed has long preferred the Implicit Price Deflator (IPD). This indicator, which is produced by the Bureau of Economic analysis, actually incorporates all goods and services, unlike the CPI which only includes a basket of goods and services. With a comprehensive view of inflation, it is little wonder the Fed takes the IPD rather seriously.
As we illustrate in Figure 3, the Implicit Price Deflator took a dive in the first quarter of 2015, falling to a level of only 0.88% versus the 1.25% reading for Q4 2014. To be sure, as a comprehensive indicator, the IPD incorporates some exposure to both food and energy. But when Headline CPI has stabilized over the past four months, it's quite puzzling that the IPD would come under such pressure at this juncture.
So at this stage of the cycle, there seems to be some real confusion about where inflation really stands. Headline CPI data tells us that inflation has been near zero for the past several months.
Core CPI data, meanwhile, tells us that inflation is beginning to stabilize in a range of 1.6% to 1.8%. The Implicit Price Deflator, on the other hand, suggests that inflation has not stabilized at all. And because the IPD is every bit as important to the inflation discussion, it's not clear to us right now why the recent data has not raised more than a few eyebrows. Either way, we do not believe that Dr. Yellen & Co. would simply ignore the Implicit Price Deflator just because it's sending a different message.
We believe that Janet Yellen really wants to lift the Fed Funds rate up and off of the zero-bound range. However, a number of confusing signals out there continue to stymie the Fed's decision making process. The Dollar is too strong. Or the economy is too weak. Greece is threatening to default. And of course China's economy is slowing down. And now the long-trusted Implicit Price Deflator is declining while the Core CPI may be stabilizing. From the Fed's perspective it's just too confusing.
Even if the Fed raises rates later in 2015, we seriously doubt that they would then embark upon a 2-year campaign of constant rate increases. We think the Fed is far more likely to raise rates in a slow and deliberate manner. Every Fed move will likely be analyzed in excruciating detail, and they won't raise rates again until they are confident the capital markets can withstand the tightening of monetary policy. Dr. Yellen & Co. is not looking to "normalize" equity valuations.
Nor is the Fed looking to invert the yield curve. We think the Fed's mission here is to figure out what constitutes the "New Normal" for a stable interest rate environment.
The Bottom Line
It's a sure bet that the markets will sell off the moment a Fed rate hike is announced. Equities will take a hit and global bond yields will rise. And when all is said and done, people will eventually realize that the entire debate surrounding the Fed's initial rate increase has been little more than a ridiculous distraction. Our Leading Indicators continue to suggest that the economy is more likely than not to maintain some forward momentum. The Fed is going to remain extremely accommodative for the foreseeable future. Building permit data continues to improve, albeit at a glacial pace.
Manufacturing data from the ISM also continues to provide positive indications for new orders.
Even the late-cycle indicator of commercial loan growth is on the right track.
We like equities here. And we'll like them even more when the next correction comes along. If Greece manages to remain solvent we'll have plenty of other catalysts to watch for, including the Fed's initial rate hike. As if anyone needs reminding, we remain in a Secular Bull Market which provides investors with all the confidence they need to "buy on the dips".
From a technical perspective, recent Bloomberg data tells us that just over 50% of all NYSE listed stocks are trading at or above their 200 day moving averages. This tells us that the ongoing new highs in the market are real, and that the market is not being held up by only a few over-priced momentum stocks. Even though people like to complain about the lofty valuations, the market remains fairly well supported right now.
0 comments:
Publicar un comentario