Jan. 22, 2015 1:39 PM ET
Summary
- The “big news” for this week – regarding the tentative size of the ECB’s quantitative easing program – was leaked a day early.
- The EURUSD, already in a waterfall decline, half-heartedly flailed around a bit. European equities remain in a stairstep down-trend.
- Could the upside move in gold continue? It’s not out of the question. The extraordinary thing would be strength in gold and strength in the USD at the same time.
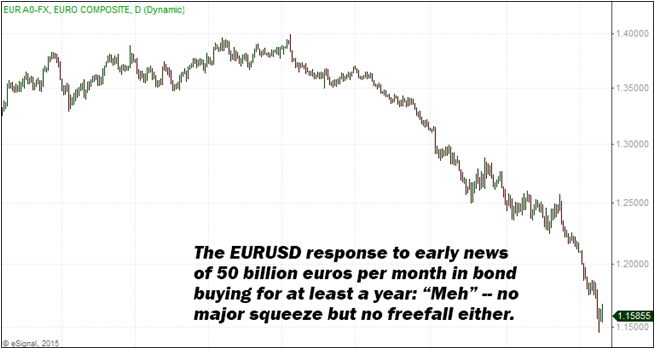
The "big news" for this week - regarding the tentative size of the ECB's quantitative easing program - was leaked a day early (see prior piece Macro View reference), and markets responded more or less with a shrug. The EURUSD, already in a waterfall decline, half-heartedly flailed around a bit, but neither screamed higher nor plummeted in freefall on news of a €50 billion per month bond-buying regime. More details will arrive soon as to what degree Germany will play ball (and whether the market's emotional response will increase).
European equities, meanwhile, remain in a stairstep down-trend - as shown via SPDR Euro STOXX 50 (NYSEARCA:FEZ) below. We are short FEZ and were glad to see minimal fireworks on the early announcement. The immediate reaction of FEZ to the bond-buying was mildly bullish… but such that the near-term trend could easily shift, back to the bearish primary trend, especially with significant levels of overhead supply and a clear downtrend intact.
(click to enlarge)

There remains a possibility European equities break out to the upside, leading to a renaissance in the Wall Street "trade du jour" (long Europe) as evidenced by recent enthusiasm on trading desks. For price to confirm this shift in stance, FEZ would have to convincingly break the current downtrend, hold the breakout, and show clear signs of sustainable follow through on a new bullish trend. We are skeptical something like this will happen, especially given the poor response to the initial "euro QE" preview. As it stands we do not have to make a bull/bear decision: The bear scenario is plausible, and if price action confirms we will pyramid shorts accordingly.
One area where price has forced us to change our minds is gold. As PTJ has put it, "Price comes first; fundamentals come second." We agree with this basic tenet because at best you might possess 70% of the pieces; unknown factors hiding in the other 30% could be enough to turn your thesis on its head. As such, we are no longer short gold and maintain long positions in the various gold and silver mining indices - Market Vectors Gold Miners (NYSEARCA:GDX), Market Vectors junior Gold Miners (NYSEARCA:GDXJ) and Global X Silver Miners (NYSEARCA:SIL). Gold's breakout action is odd in juxtaposition with a super strong USD, but has plausible explainability in light of other factors (e.g. QE anticipation / eurozone capital flight).
(click to enlarge)
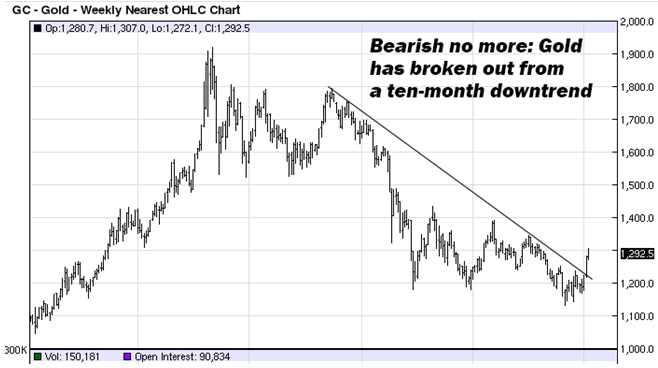
Could the upside move in gold continue? It's certainly not out of the question. The extraordinary thing would be strength in gold and strength in the USD running at the same time. On the other hand, we live in extraordinary times… in a world where EURUSD could conceivably fall to 85 cents (if things get bad enough across the pond), and in which capital flight is occurring in other major currencies besides the USD, most anything could happen. Non-USD gold flight could explain it.
As for EURUSD falling all the way to 85 cents, this is tied to the "in for a penny, in for a pound" idea: Some argue that, once "euro QE" begins, they'll be forced to keep going (and going…) especially if mighty Germany itself is hit by economic slowdown, born of deflationary impacts via China malaise and competitive currency devaluations in the yen and won.
By the way, speaking of USD strength… do we even need to show you (again) that crazy 25-year bullish dollar chart? The greenback continues to go vertical… and the move may be nowhere near done. David Kotok of Cumberland Advisors:
BCA Research observes that "the U.S. dollar moves in big cycles." They estimate that USD "trade-weighted" strengthening is up 23% so far in this cycle. BCA notes that the cycle in the 1990s involved a total move of 53%. The move of the late 1970s to mid-1980s was 57% according to their estimates. They add JPMorgan Chase as a research source in their calculation. If BCA is correct, we may not be even halfway through the strengthening move. And Switzerland's action is not a significant weight in the [total] calculation.
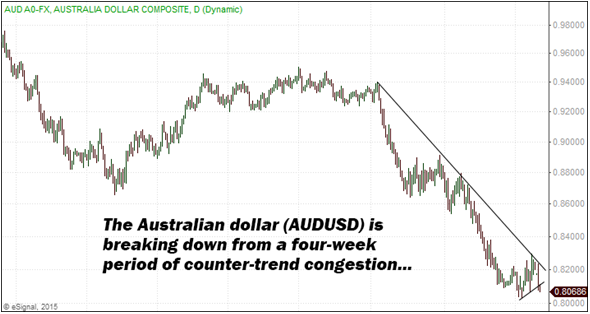
On the commodity currency front, the dollar / loonie took off like a rocketship this week… the USDCAD chart, taking a cue from treasury bonds, looks like a spaceship leaving earth. We are long USDCAD, which goes up as the Canadian dollar weakens, but short AUDUSD (as shown above) which goes down as the Aussie dollar weakens. We show you AUDUSD because a potential entry or pyramid position is at hand… indeed we just triggered a pyramid short in the Aussie even as this Tactical View was being completed. (For access to all of our positions, including daily email commentary, morning trade setups, and real-time fill reporting, check out the Mercenary Live Feed.
A simple memory trick for currency pairs by the way: The first currency in the pair is like the numerator (the top part of the fraction), while the second currency is the denominator (or the bottom of the fraction). As such, when USDCAD sees the USD getting stronger, it goes up as "USD" pulls it upward, like a balloon lifting an object. But when AUDUSD sees the USD get stronger, the now-denominator USD acts like a heavy weight, sinking "AUD" like a stone in a pond. So now you can see why EURUSD drops when the euro weakens… the "USD" denominator sinks it… and also why EURCHF went down when the peg was broken (the "CHF" did the same thing).
The key is that whichever currency of the pair is strongest at the time determines whether the pair moves up or down - if the numerator (first half) currency is stronger, the pair rises (like a balloon); but if the denominator (second half) is stronger, the pair sinks (like a stone in water). Once you grok this, you can glance at any odd currency pairing (for example AUDJPY) and have a sense of what the pairing means, in terms of who is trending strong and who is trending weak…
(click to enlarge)
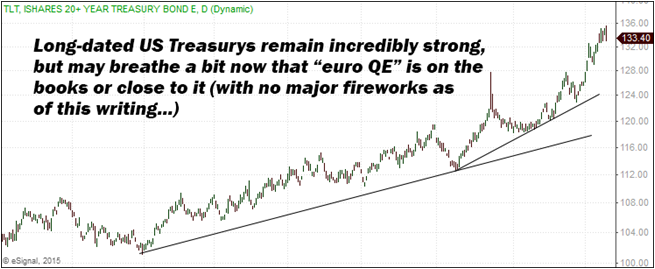
Speaking of weakness potential, US Treasuries remain super strong (as shown above), but may be due for a breather now that "euro QE" is in the books (or the early preview of such anyway). We remain long USTs [via our short position in ProShares UltraShort 2-+ Year Treasury (NYSEARCA:TBT), the inverse treasury bond ETF], but have since lightened up a bit more in anticipation of a pullback in the bigger trend. (The market could yet keep climbing, of course, which is why we still have a long position on, having taken an additional round of partial profits rather than full.)
(click to enlarge)

On the US equity side, we are short Financial Select Sector (NYSEARCA:XLF) and SPDR S&P Bank ETF (NYSEARCA:KBE), and also short small caps - via Direxion Daily Small Cap Bull 3X (NYSEARCA:TNA) - plus varied long positions on the individual equity front. Bulls will have a very hard time overcoming the bearish outlook in financials: In historic terms, it is hard for a bull market to get its mojo back when the financials have decisively rolled over.
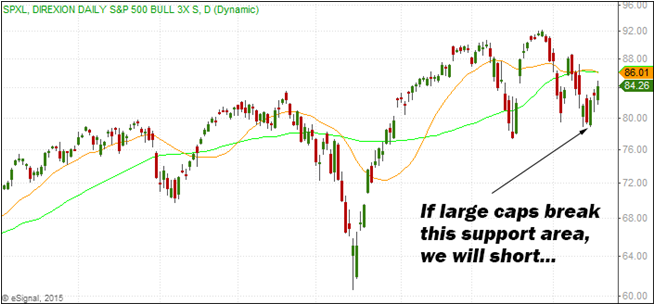
Large cap stocks as shown below via Direxion Daily S&P 500 Bull 3X (NYSEARCA:SPXL) are also feeling the pain. The S&P 500 is now close to registering a downside 20 / 50 day moving average cross (as shown by the gold and green lines). We see added potential for large cap weakness as the profit-cutting impact of USD strength, anticipated in these pages, has finally begun to register in corporate outlooks. Companies like Tiffany's (NYSE:TIF) have seen large share price declines on reduced outlooks and lower sales, blamed on sharp USD appreciation and lessened emerging market activity. The WSJ has also run headlines this past week with titles like "Dollar Squeezes U.S. Firms" and "How the Rising Dollar Has Pressured U.S. Manufacturers."
If BCA Research is correct (and we believe they are), the USD run could be less than halfway through. If this is the case, the pain felt by multinationals (via reduced profit outlooks) is only beginning (even as the Fed enters a tightening cycle).
(click to enlarge)
The above was broadcast on January 21st, 2015 via the Strategic Intelligence Report.
0 comments:
Publicar un comentario