Dec. 27, 2014 2:42 AM ET

Summary
- Our analysis of gold costs includes more than 25% of total world gold production and thus we're confident it can be extrapolated very accurately.
- Gold miners on a core cost basis are producing gold at a higher cost than the previous two quarters due to an increase in taxes.
- Gold miners on a core non-tax cost basis saw their costs drop sequentially, but are relatively flat on the year.
- Despite heavy cost cutting, most gold is produced at prices higher than the current gold price, and that is bullish for the gold price.
We're looking to add companies to the list that we cover and use them in our total FY2014 analysis, so if you are interested in receiving it and keeping up-to-date, consider following me (clicking the "Follow" button next to my name).
Why These Costs Are Important
For gold ETF investors (SPDR Gold Trust ETF (NYSEARCA:GLD), ETFS Physical Swiss Gold Trust ETF (NYSEARCA:SGOL), Central Fund of Canada (NYSEMKT:CEF), and Sprott Physical Gold Trust (NYSEARCA:PHYS)), this metric is very important because it allows an inside understanding of the true costs associated with producing each new ounce of gold. This is arguably the most important metric in analyzing any commodity because it shows the price where production of that commodity becomes uneconomic. If it costs more to mine a commodity than the market is willing to pay for it, eventually producers will stop producing the commodity and close up shop.
These are the type of environments that savvy commodity investors dream of because it allows them to purchase assets that cost more to produce than to buy, which is an environment that cannot last for very long because eventually supply will be cut, cause scarcity, and then the price will increase.
There are some people that erroneously believe that newly mined gold supply is irrelevant to the gold price. Unfortunately, this causes investors to completely ignore the fundamentals of global gold mine supply and leaves a large hole in their understanding of the gold market. This article isn't the place to go into why they are wrong, but I've addressed this issue thoroughly in a previous article with quotes.
But to make a long story short, the two main reasons why newly mined gold supply is very important to the gold price are the following:
- Newly mined gold supply makes up a large portion of annual gold supply (it provides two-thirds of annual physical demand, according to the World Gold Council's numbers).
- It is held in the weakest hands (the gold miners) who sell that gold at the prevailing market price.
Explanation of Our Metrics
For a detailed explanation of the metrics and each metric's strengths and weaknesses please check out our previous full quarterly all-in costs gold report where we discuss them in detail. The last two metrics (core costs and core non-tax costs) are the most important ones in our opinion, but we provide all four for investors to use.
All Costs per Gold-Equivalent Ounce - These are the total costs incurred for every payable gold-equivalent ounce, which includes everything. This is the broadest measure of costs, and since it includes write-downs, it is essentially the "accounting cost" of producing gold-equivalent ounces.
Costs Per Gold-Equivalent Ounce Excluding Write-downs and S&R - This is the cost to produce each gold-equivalent ounce when subtracting write-downs and smelting and refining costs, but including everything else.
Costs Per Gold-Equivalent Ounce Excluding Write-downs (Our "Core Costs" Metric) - This is similar to the above-mentioned "Costs per Gold-Equivalent Ounce Excluding Write-downs and S&R" but includes smelting and refining costs. That makes this measure one of the best ways to estimate the true costs to produce each ounce of gold, since it has everything (including taxes) except for write-downs.
Costs per Gold-Equivalent Ounce Excluding Write-downs & Taxes (Our "Core Non-Tax Costs" Metric) - This measure includes all costs related to gold-equivalent production, excluding all write-downs and taxes. Essentially, this is the bottom dollar costs of production with an artificial 0% tax rate (obviously unsustainable) which works well because it removes any estimates of taxation due to write-downs or seasonal fluctuations in tax rates, which can be significant. The negative to this particular measure is that since it does not include taxes, it will underestimate the true costs of production.
What are the Industry's Gold Costs?
We have compiled all the numbers for gold companies that we analyzed for 2014 and provided them in the table below. Investors should remember that these costs are displayed and sorted by core non-tax costs, as in costs BEFORE taxes and thus are lower than the real costs of production. To see the real costs of production investors can click on the detail of any of the companies listed below.
Important Note: For our gold equivalent calculations, we have adjusted the numbers to reflect the second-quarter average LBMA price for all the metals and converted them into gold at these rates which results in a silver-to-gold ratio of approximately 65:1, copper-to-gold ratio of 404:1, lead-to-gold ratio of 1295:1, and a zinc-to-gold ratio of 1221:1.
Investors should remember that our conversions change with metal prices and this will influence the total equivalent ounces produced for past quarters - which will make current-to-past quarter comparisons much more relevant. This will also lead to minor differences in our previously published true all-in gold costs for the industry since each period has different conversion rates into gold - it will not make a big difference but there will be a difference.
(click to enlarge)
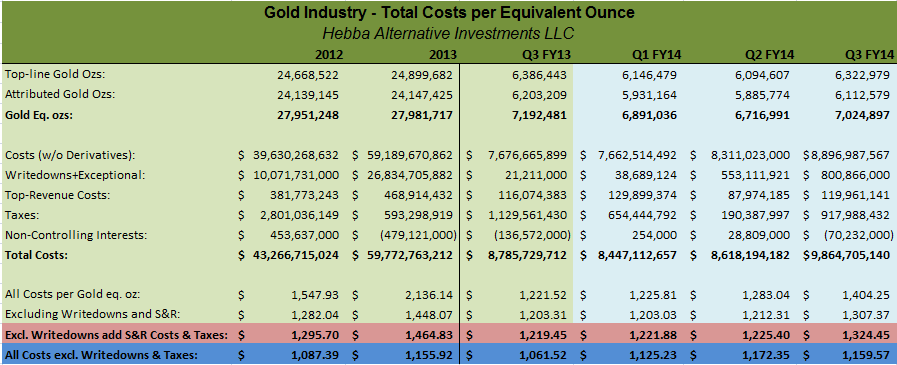
Important Note on Gold Table Above: The difference between "Top-line Gold Ounces" and "Attributed Gold Ounces" is that top-line ounces include ounces produced by miners that are not a portion of their true distribution of production. Attributable ounces are the true ounces that represent a miner's share of production.
To calculate costs, we remove all costs associated to top-line ounces and the top-line ounces themselves to make sure we have accurate cost figures.
Observations for Gold Investors
The first thing gold investors should notice is that in the third quarter we saw a rise in attributable gold production from 5.89 million ounces to 6.11 million ounces, which is around a 5% gain sequentially - with almost 200,000 ounces of this gain attributed to Barrick's additional production.
On a year-over-year basis, though, we saw attributable ounces drop slightly from the 6.20 million ounces we saw in Q3FY13. In general, it seems like gold production will end the year essentially flat - assuming we don't have an extremely good or bad fourth quarter.
Total gold-equivalent production rose by a slightly larger percentage, but we're not particularly surprised as during the quarter most base metals appreciated in terms of their conversion ratios with gold, which would lead to higher gold-equivalent production - though we did see an increase in base metal production by a few gold miners.
Cost Structure of the Miners
But we think the more important statistics here for investors are related to the cost structure of the companies because ultimately production will follow the margin of the miners. As margins rise, gold production will tend to increase, while if margins are falling (or negative), then production will eventually fall - pretty straight forward long-term economic law here.
In terms of core costs (costs including taxes), during the quarter we saw core costs rise on both a sequential and year-over-year basis to $1324 per gold-equivalent ounce. That was the highest for the year and significantly higher than previous quarters despite the increased production (which should have averaged down the cost per ounce).
When we take a look at core non-tax costs (costs excluding write-downs and taxes) we see that costs actually fell on a sequential basis to $1160 per gold-equivalent ounce. That's pretty much the mid-point of what we saw in previous quarters and it tells us that taxes were a significant contributor to the rise in core costs.
Conclusion for Investors
Let's now focus on the actual numbers and what they mean. The fact that core costs were $1324 per gold-equivalent ounce really means that miners, on average, are still well above the gold price when we include all their costs. Of course, this number is a quarterly number and can fluctuate quite a bit from quarter-to-quarter, but even if we look at the first quarter ($1222) and second quarter ($1225) numbers we see that the costs to produce gold are above the current spot price when all costs are taken into account.
When it comes to core non-tax costs, which may be a better indicator into the general trend of mining costs as it leaves out taxes and write-downs, we see that costs for the quarter ($1160 per gold-equivalent ounce) were down slightly from the previous quarter but up from the first quarter. While they aren't above the current spot price, these are costs before taxes and there is very little margin for miners to make any meaningful profits - a 2-3% margin on such a risky endeavor like mining a deposit will severely discourage future investment.
Additionally, these core non-tax costs completely ignore taxation, which in the natural resource business often includes royalties and revenue-based taxes. Thus, a portion of taxes will hit the miners regardless of their profits - thus this 2-3% on sub-$1200 gold quickly disappears.
The fact that core and core non-tax costs are not sustainable at the current gold price, may not have much of an effect on production this quarter - but it certainly will in future quarters and years. Investors need to remember that the seeds of gold production five and ten years from now are being sown today.
Miners still haven't cut costs enough to make a decent profit on a core costs basis, and this suggests that there is a structural problem with producing gold at the current gold price. This supports our belief (and the belief of many in the industry) that we've reached peak gold and soon we'll see production start dropping significantly as operations are closed and wind down.
For mining investors that means that you have to be very careful which miners to invest in if we don't see a higher gold price. But for investors that own the gold ETFs and physical gold, this is a very promising trend as the miners' pain is the gold investors' gain - more struggling miners means less future production.
The fact that miners still cannot get costs lower suggests to us that the gold price really isn't sustainable below $1200 per ounce on any intermediate to long period of time. So while some prognosticators calling for $1000 gold (Goldman we're looking at you) may be right on the short term, there really is no way in our minds how we can see that gold price for very long - most gold would cease to be produced.
So as long as investors can take a little volatility, we think that some time in the next few years gold will be much higher as supply is choked off by the current gold price. If gold demand actually increases during this time frame, then we could see some fireworks in the gold price as supply simply will not be ramped up enough to meet any increase in demand.
Gold is a much safer investment than the financial media seems to think, and gold investors should sleep well knowing that production costs are on their side.
0 comments:
Publicar un comentario