May 14, 2014
Soon Rates Will Spike and So Will Gold
Chris Vermeulen

Since the top in gold in 2011, gold has been in a bear market. Depending on your outlook, this 3 year down trend could also be seen as consolidation within a major cyclical bull market. Either way, the outlook is bullish, that is if gold can bottom this year.
The average bear market in gold has corrected roughly 33% and lasts about 550 days. And the current correction in gold has thus far been 38% and about 700 days. So it’s easy to assume precious metals are nearing a significant low.
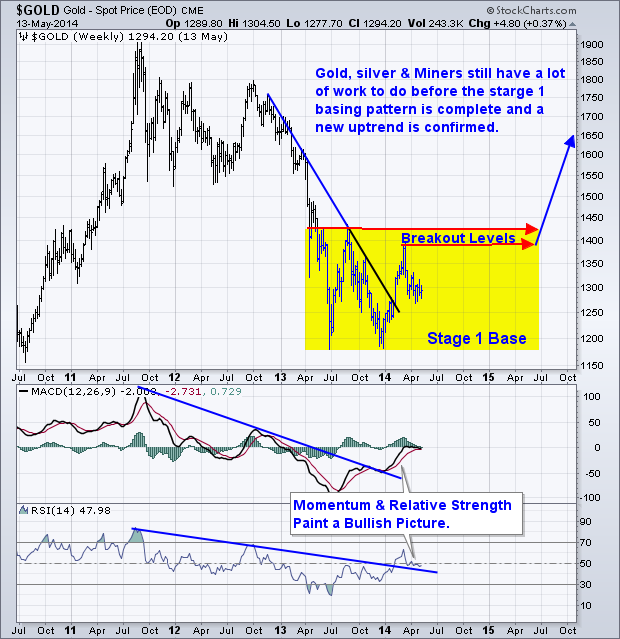
You can see my recent technical analysis and gold forecast.
You can see my recent technical analysis and gold forecast.
Snap shot of the gold forecast chart:
The weekly chart while still in a clear down trend, could be in the early phase of a stage 1 basing pattern. Technical are pointing to strength with the MACD moving higher, relative strength is rising, and the first down trendline on the gold price chart has been broken.
Also we had the Golden Cross happen which is not shown on the chart. This is when the 50 day moving average crosses above the 200 day moving average. This is a long term bullish signal for many investors, though I do not put much weight into moving averages crossing over one another.
If historical data/statistics, and technical analysis prove to be correct we should expect to see gold trading between $2300 - $2500 per ounce within 24 months.
Gold Forecast Conclusion:
With the average gold bull market lasting roughly 450 days, and the average percent gain in gold being 95% I feel precious metals are will bottom this year, if they have not yet done so.
Note that until gold breaks out of its Stage 1 Basing pattern, I will remain bearish/neutral on the metal.
0 comments:
Publicar un comentario