Oil Prices Rebound Sharply As U.S. Net Petroleum Imports Sink To Lowest Level On Record
Jan. 15, 2014 6:34 PM ET
by: Hard Assets Investor
By Sumit Roy
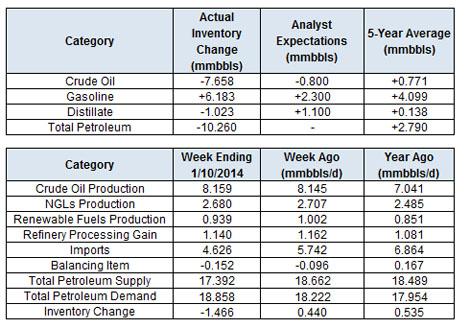
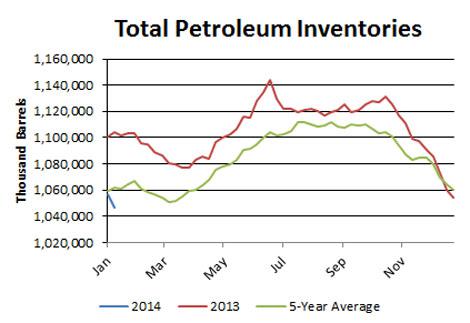
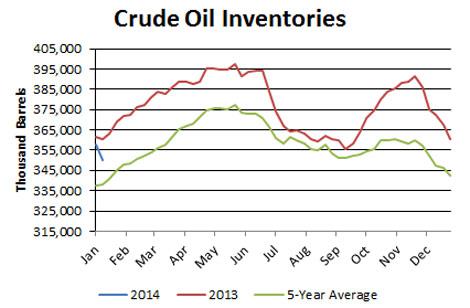
The Department of Energy reported this morning that in the week ending Jan. 10, U.S. crude oil inventories decreased by 7.7 million barrels, gasoline inventories increased by 6.2 million barrels, distillate inventories decreased by 1 million barrels and total petroleum inventories decreased by 10.3 million barrels.
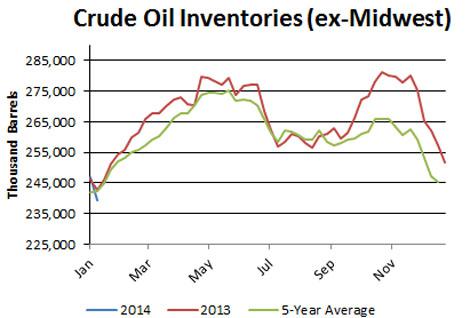
Crude oil prices jumped after the release of the latest inventory figures. Total petroleum inventories in the U.S. are now solidly below the five-year average, and outside of the Midwest, even crude oil inventories are below the five-year average.
This was bound to happen. Prices for U.S. crudes were well below those in other countries, and exporters have responded by shipping significantly less oil to the country.
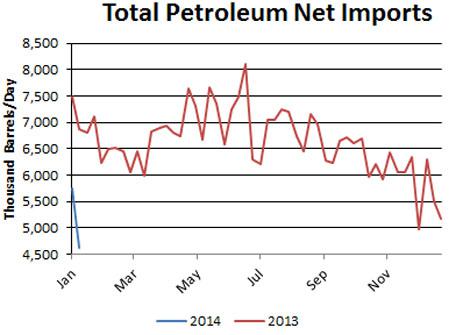
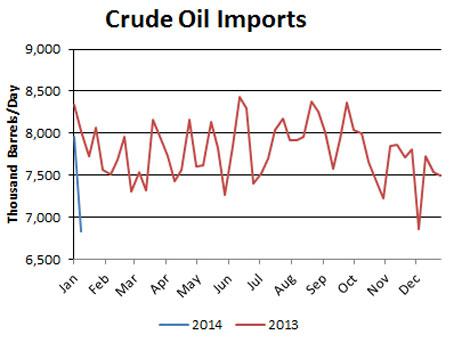
Crude oil imports plummeted to 6.83 million barrels per day last week, the lowest level since January 2000, while total petroleum net imports sunk to 4.63 million barrels per day, the lowest point on record going back to 1991.
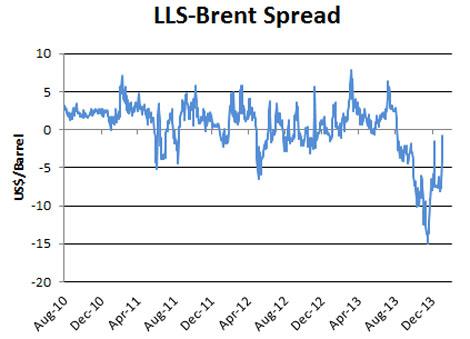
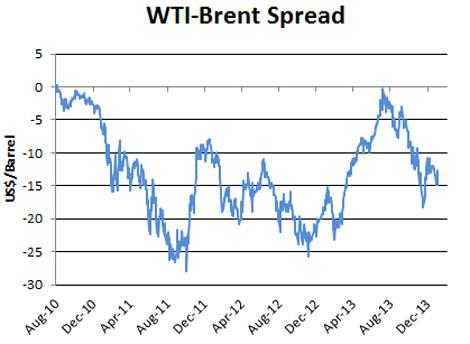
In turn, we've seen a sharp rise in U.S. Gulf Coast crude oil prices. Louisiana Light Sweet is now essentially trading at par with Brent, a sharp reversal from the discount of nearly $15 seen as recently as November.
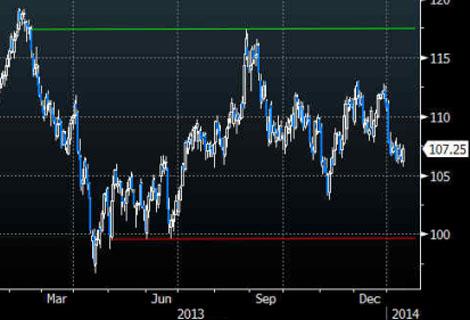
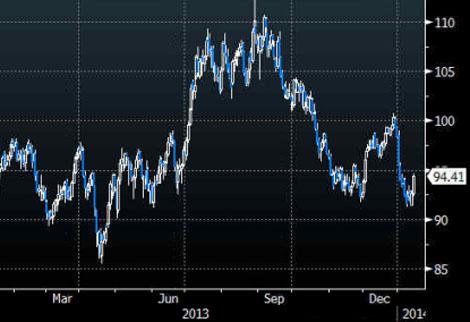
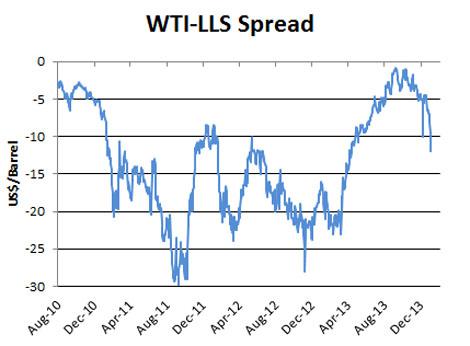
However, WTI hasn't been able to keep up with the rally in its U.S. counterpart, and remains almost $13 below Brent prices. But just as the LLS-Brent spread was arbitraged away, the same may happen for the WTI-LLS spread.
Midwest oil producers have every incentive to ship barrels to the Gulf Coast to sell for premium prices. The only question is whether there is enough infrastructure to carry oil out of the landlocked region. Pipeline and infrastructure bottlenecks have plagued the Midwest frequently since 2010, but the massive Gulf Coast Pipeline Project - which begins operations this month - will help alleviate any glut by shipping 700,000 barrels per day from Cushing, Okla., to Texas.
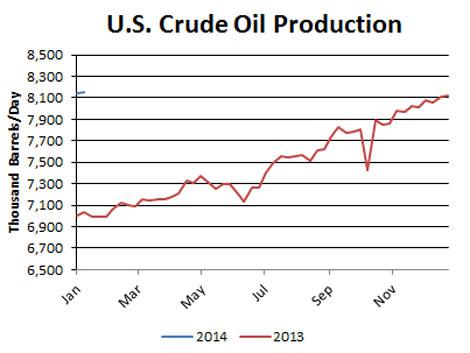
Of course, if U.S. oil production continues to surge - output hit another multidecade high at 8.16 million barrels per day last week - pipeline capacity may be overwhelmed, keeping WTI depressed.
In any case, at a $13 discount to Brent, WTI is a much more attractive buy than its European counterpart. While we are bearish on oil in general in 2014, we see outperformance in WTI on a relative basis throughout the year.
BRENT
WTI
Turning to this week's EIA inventory figures, total petroleum inventories in the U.S. fell by 10.3 mmbbl, against the five-year average of a 2.8 mmbbl decrease. In turn, the inventory deficit rose to 15.5 mmbbl, or 1.5 percent.
Crude oil inventories fell by 7.7 mmbbl, against the five-year average of a 0.8 mmbbl increase. In turn, the surplus in the crude category fell to 12.1 mmbbl, or 3.6 percent.
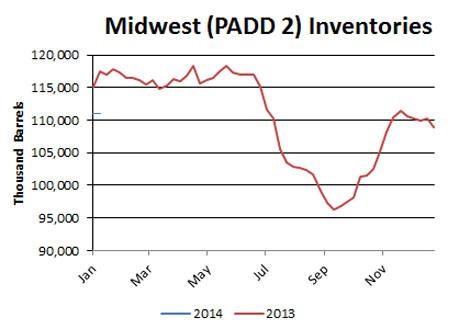
Regionally, inventories inside and outside the Midwest fell.
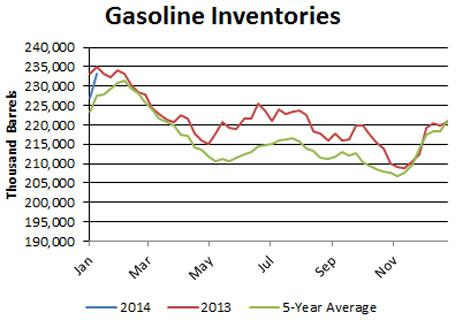
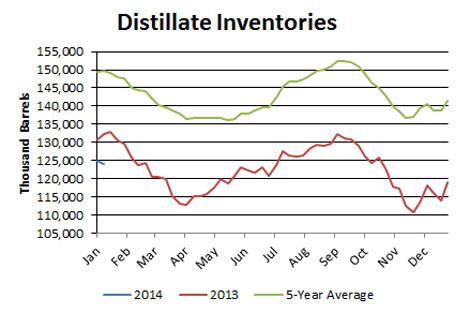
Gasoline inventories rose by 6.2 mmbbl against the five-year average of a 4.1 mmbbl increase. The gasoline surplus now stands at 5.6 mmbbl, or 2.5 percent. Distillate inventories fell by 1 mmbbl against the five-year average of a 0.1 mmbbl increase. In turn, the distillate deficit widened to 25.7 mmbbl, or 17.2 percent.
Demand
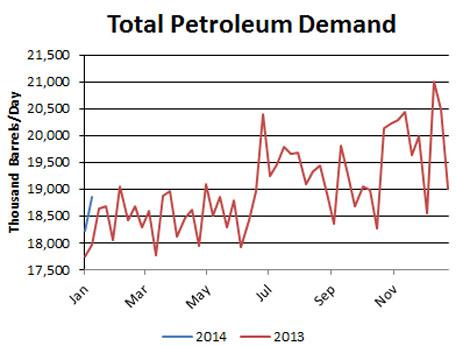
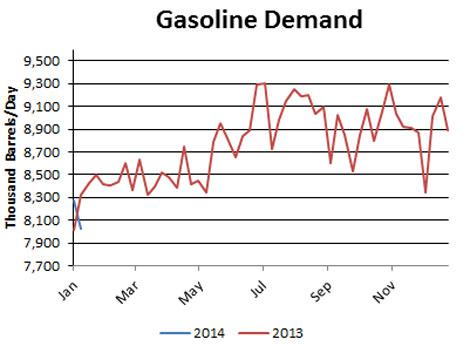
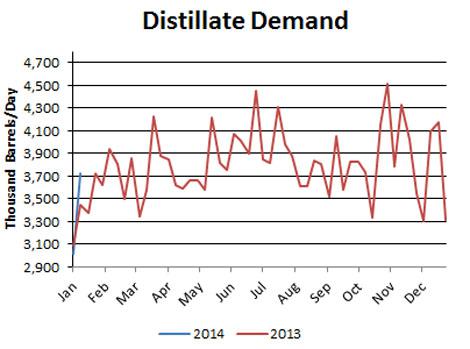
Total petroleum demand in the U.S. jumped to 18.9 mmbbl/d, while gasoline demand fell to 8 mmbbl/d and distillate demand rose to 3.7 mmbbl/d. On a four-week rolling basis, total demand was up by 4.2 percent from last year. On that same basis, gasoline demand was up by 2.7 percent and distillate demand was up by 5.4 percent.
It's worth noting that these figures may be overstated due to the EIA's methodology for calculating demand. The administration does not distinguish between domestic demand and exports. Given that U.S. product exports (distillates, in particular) are running at record levels, U.S. oil demand seems greater than it is.
Imports
Crude oil imports fell by 1.1 mmbbl/d to 6.9 mmbbl/d. On a four-week rolling basis, imports have averaged 5.3 percent below the year-ago level.
Refinery Activity
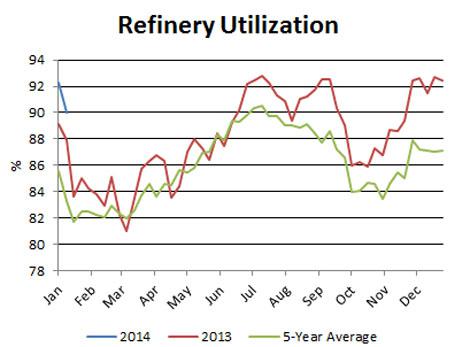
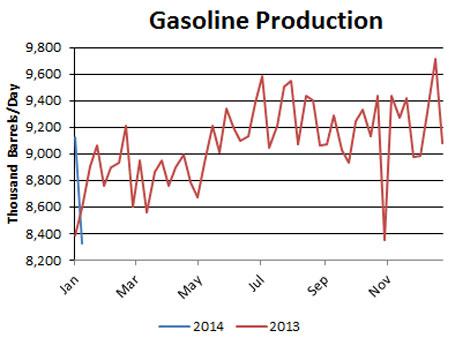
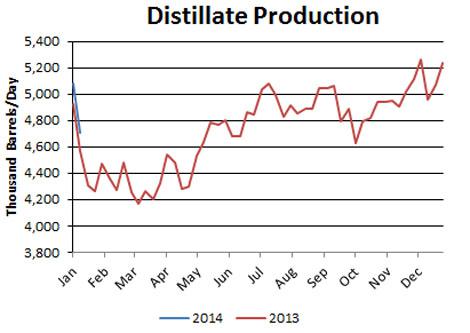
Refinery utilization ticked down from 92.3 to 90 percent. Utilization is well above the year-ago level and the five-year average. Gasoline fell sharply to 8.3 mmbbl/d, while distillate production fell to 4.7 mmbbl/d.
Miscellaneous
U.S. crude oil production edged up to 8.159 mmbbl/d, the highest level since July 1988. Output has been rising swiftly this year due to surging production in unconventional oil plays. Since the start of the year, output has averaged 1.1 mmbbl/d, or 16.1 percent, above the same period a year ago.
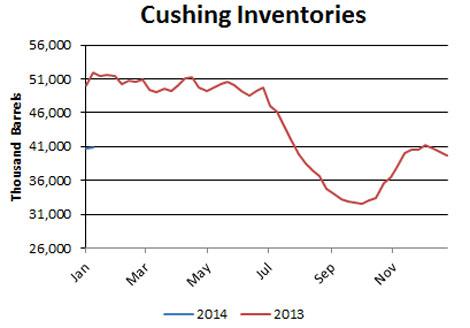
Inventories at the Nymex delivery point in Cushing, Okla., rose by 0.1 million barrels to 40.9 million barrels, or 52.9 percent of the EIA's estimate of capacity. Overall, Midwest inventories fell by 0.1 million barrels to 111 million barrels, or 72 percent of estimated storage capacity.
Front-month WTI calendar spreads remained in contango at +$0.19.
Front-month Brent calendar spreads remained in backwardation at -$0.79.
West Texas Intermediate's discount to Brent fell week-over-week from -$14.84 to -$12.72. WTI's discount to Louisiana Light rose from -$6.80 to -$12.
Crude oil prices jumped after the release of the latest inventory figures. Total petroleum inventories in the U.S. are now solidly below the five-year average, and outside of the Midwest, even crude oil inventories are below the five-year average.
This was bound to happen. Prices for U.S. crudes were well below those in other countries, and exporters have responded by shipping significantly less oil to the country.
Crude oil imports plummeted to 6.83 million barrels per day last week, the lowest level since January 2000, while total petroleum net imports sunk to 4.63 million barrels per day, the lowest point on record going back to 1991.
In turn, we've seen a sharp rise in U.S. Gulf Coast crude oil prices. Louisiana Light Sweet is now essentially trading at par with Brent, a sharp reversal from the discount of nearly $15 seen as recently as November.
However, WTI hasn't been able to keep up with the rally in its U.S. counterpart, and remains almost $13 below Brent prices. But just as the LLS-Brent spread was arbitraged away, the same may happen for the WTI-LLS spread.
Midwest oil producers have every incentive to ship barrels to the Gulf Coast to sell for premium prices. The only question is whether there is enough infrastructure to carry oil out of the landlocked region. Pipeline and infrastructure bottlenecks have plagued the Midwest frequently since 2010, but the massive Gulf Coast Pipeline Project - which begins operations this month - will help alleviate any glut by shipping 700,000 barrels per day from Cushing, Okla., to Texas.
Of course, if U.S. oil production continues to surge - output hit another multidecade high at 8.16 million barrels per day last week - pipeline capacity may be overwhelmed, keeping WTI depressed.
In any case, at a $13 discount to Brent, WTI is a much more attractive buy than its European counterpart. While we are bearish on oil in general in 2014, we see outperformance in WTI on a relative basis throughout the year.
BRENT
WTI
Turning to this week's EIA inventory figures, total petroleum inventories in the U.S. fell by 10.3 mmbbl, against the five-year average of a 2.8 mmbbl decrease. In turn, the inventory deficit rose to 15.5 mmbbl, or 1.5 percent.
Crude oil inventories fell by 7.7 mmbbl, against the five-year average of a 0.8 mmbbl increase. In turn, the surplus in the crude category fell to 12.1 mmbbl, or 3.6 percent.
Regionally, inventories inside and outside the Midwest fell.
Gasoline inventories rose by 6.2 mmbbl against the five-year average of a 4.1 mmbbl increase. The gasoline surplus now stands at 5.6 mmbbl, or 2.5 percent. Distillate inventories fell by 1 mmbbl against the five-year average of a 0.1 mmbbl increase. In turn, the distillate deficit widened to 25.7 mmbbl, or 17.2 percent.
Demand
Total petroleum demand in the U.S. jumped to 18.9 mmbbl/d, while gasoline demand fell to 8 mmbbl/d and distillate demand rose to 3.7 mmbbl/d. On a four-week rolling basis, total demand was up by 4.2 percent from last year. On that same basis, gasoline demand was up by 2.7 percent and distillate demand was up by 5.4 percent.
It's worth noting that these figures may be overstated due to the EIA's methodology for calculating demand. The administration does not distinguish between domestic demand and exports. Given that U.S. product exports (distillates, in particular) are running at record levels, U.S. oil demand seems greater than it is.
Imports
Crude oil imports fell by 1.1 mmbbl/d to 6.9 mmbbl/d. On a four-week rolling basis, imports have averaged 5.3 percent below the year-ago level.
Refinery Activity
Refinery utilization ticked down from 92.3 to 90 percent. Utilization is well above the year-ago level and the five-year average. Gasoline fell sharply to 8.3 mmbbl/d, while distillate production fell to 4.7 mmbbl/d.
Miscellaneous
U.S. crude oil production edged up to 8.159 mmbbl/d, the highest level since July 1988. Output has been rising swiftly this year due to surging production in unconventional oil plays. Since the start of the year, output has averaged 1.1 mmbbl/d, or 16.1 percent, above the same period a year ago.
Inventories at the Nymex delivery point in Cushing, Okla., rose by 0.1 million barrels to 40.9 million barrels, or 52.9 percent of the EIA's estimate of capacity. Overall, Midwest inventories fell by 0.1 million barrels to 111 million barrels, or 72 percent of estimated storage capacity.
Front-month WTI calendar spreads remained in contango at +$0.19.
Front-month Brent calendar spreads remained in backwardation at -$0.79.
West Texas Intermediate's discount to Brent fell week-over-week from -$14.84 to -$12.72. WTI's discount to Louisiana Light rose from -$6.80 to -$12.
0 comments:
Publicar un comentario