Is The Gold Market Manipulated? Part 1: Introduction And The London Gold Pool
Nov 23 2013, 18:07

Recently I wrote an article on the topic of silver manipulation, in which I argue that while there is no definitive proof that the silver price is artificially depressed, there is overwhelming circumstantial evidence pointing to manipulation, and that the manipulation thesis is by far the most reasonable way of explaining a series of otherwise uncanny phenomena including:
Repeated outsized moves in the price of silver (33% in a week, 10% in a few minutes...etc.) to the downside.
Repeated outsized moves in the price of silver (33% in a week, 10% in a few minutes...etc.) to the downside.
- A whistleblower, claiming that the market is manipulated, who was able to predict downward price movement in the silver price with incredible timing.
- Extraordinary volume in the amount of silver traded relative to the amount of known silver (e.g. over 100 years worth of silver production traded on April 14th, 2013).
Gold manipulation is a closely related story to silver manipulation.
1) Both gold and silver often trade together, and they are both monetary metals.
2) The proponents of the silver manipulation theory also support the gold manipulation theory.
However in many ways the gold manipulation story is very different than that of silver manipulation. Much of the circumstantial evidence that is cited as evidence of silver manipulation is not suitable for supporting the gold manipulation thesis:
1) There are wide price swings in the gold price, but they don't rival those in the price of silver, and one wouldn't resort to the claim that the gold market is manipulated based on price action the way one might with silver.
2) We cannot point to abnormal amounts of trading in the gold market the way we can with silver. True, we can see high volume days, but because gold isn't consumed the way that silver is, we never see trading volume that outweighs the known quantity of above-ground physical gold.
The evidence for gold manipulation comes in a more "official" form. It is found in central bank minutes and legal decisions. Thus while the price manipulation leaves less of a market footprint, as I will demonstrate we can actually make claims to the effect of "Gold price suppression is government or Federal Reserve (or other central bank) policy." much the same way that silver price suppression was open government policy in the 1960s and 1970, a topic I discuss in my article on silver manipulation.
In this set of articles I discuss the case supporting the claim that the gold market is manipulated. I will first discuss the concept of price manipulation. I will then discuss the London Gold Pool as an historical example of central bank gold price manipulation. Finally I will discuss modern-day gold manipulation. Since the discussion is rather lengthy I am breaking it up into two articles. In this one I will introduce the notion of manipulation and I will give the reader background information on the London Gold Pool and the events surrounding it. In the following article I will discuss the actual evidence for gold manipulation today and in the recent past.
Price Manipulation
The term "price manipulation" is complex and loaded. Before I offer my definition let us look at the definition given by the CFTC according to their glossary:
Manipulation: Any planned operation, transaction, or practice that causes or maintains an artificial price. Specific types include corners and squeezes as well as unusually large purchases or sales of a commodity or security in a short period of time in order to distort prices, and putting out false information in order to distort prices.
Essentially the definition boils down to the first sentence, and so we must look at the CFTC's definition of "artificial price":
Artificial Price: A futures price that has been affected by manipulation and is thus higher or lower than it would have been if it reflected the forces of supply and demand.
The obvious circular causality that exists between the two terms leads me to assert that the CFTC's definition of manipulation is completely worthless: they claim that manipulation leads to an artificial price, which is caused by manipulation.
I propose a simple yet forceful alternative below that provides specific conditions by which one can empirically test allegations of manipulation. Manipulation occurs when:
A: A market participant buys and/or sells an asset or a derivative contract related to that asset in order to control its price.
B: The participant does so in order to achieve some agenda other than directly profiting from the aforementioned trading activity.
This does not necessarily mean that the market participant doesn't profit from this trading activity.
Furthermore, this does not necessarily mean that the price manipulation scheme is successful, as this definition concerns itself with a market participant's intent and actions in the marketplace, not the results of his or her actions. The London Gold Pool and the U. S. government's attempt to maintain the price of gold at $35/ounce exemplify this.
Finally I should note that under this definition of price manipulation, or under any similar definition, it is very difficult to prove because manipulation involves intent. In my discussion on silver manipulation, while i openly express my belief that manipulation does occur, I am very clear that I cannot go beyond the point of saying that I am highly suspicious of the price action in the silver market. In my discussion on gold manipulation I believe that I provide evidence that can prove an intent to manipulate.
The London Gold Pool
In order to understand manipulation in the gold market today we need to look at the London Gold Pool (LGP, hereon), which was a pooling of gold in the 1960s by a group of Central Banks used to maintain the $35/ounce price that was set in the Bretton Woods agreement. While secretive at the time the existence and intent of the LGP is known among gold investors and traders today. Furthermore back when the LGP operated its existence was hidden only insofar as it wasn't publicized: those who closely followed the Federal Reserve or the world of banking and gold more generally likely knew about the LGP.
The LGP can show us the following:
1)Gold manipulation is not new.
2)Gold manipulation can go on for many years despite bullish fundamentals such as a rising money supply or political and economic uncertainty.
3)Gold manipulation cannot go on forever.
Furthermore, the LGP is similar to modern-day manipulation in many respects. While derivative markets are more sophisticated today there is a similar strategy today as was employed back then. Gold isn't just sold into the market--it is sold and then bought back at lower prices. This enables central bankers to continue the manipulation for longer, as the selling not only lowers the price, but it leads other holders of gold to question the asset's value, and so they sell to the manipulators on the cheap.
A: Leading Up to the London Gold Pool
The LGP was set up in order to preserve the monetary system agreed upon in the Bretton Woods agreement. This system was a gold exchange standard, whereby the U.S. dollar was valued at 1/35th of an ounce of gold, and the other major global currencies were pegged to the dollar. A gold exchange standard, as opposed to a gold standard, means that while the currencies involved were worth a fixed amount of gold, they were worth this amount of gold by virtue of being pegged to another currency--the dollar--which in turn was not freely convertible into gold, but which could only be exchanged for gold by foreign governments and central banks.
Throughout the late 1940s and 1950s the supplies of these currencies fluctuated. In fact the supply of dollars had been steadily rising since the price of gold had been set at $35/ounce in 1934. Further, while the U.S. gold stock was rising it wasn't rising as quickly as the money supply, and so the 1944 fixed price likely could not have been sustained to begin with. The following chart of the M1 money supply in the U.S. shows a greater than 4-fold increase from 1934 to 1944. M1 money supply rose from about $20 billion to $86 billion during this time-frame. Furthermore, it rose to $141 billion by 1961 when the LGP was instituted.
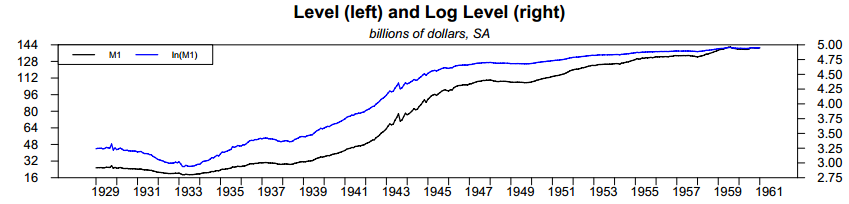
(Source: St. Louis Federal Reserve)
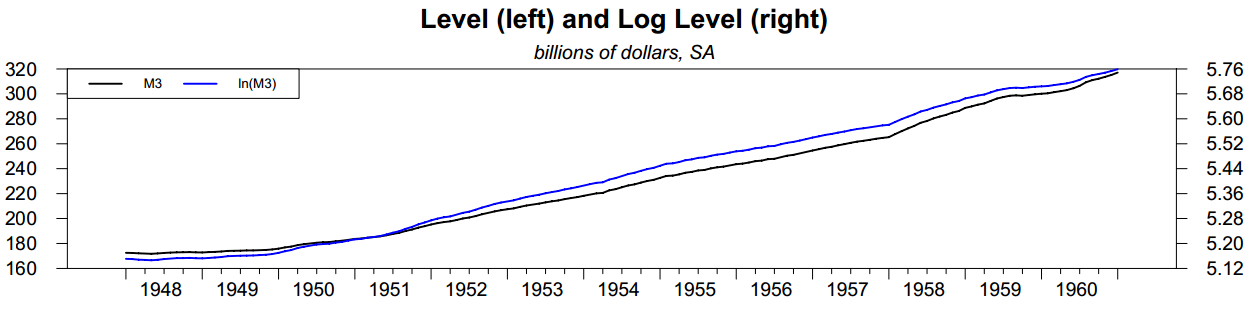
While the St. Louis Fed doesn't provide data for broader levels of money supply before 1948, the data that it does supply shows that M2 and M3 nearly doubled from 1948 to the beginning of 1961 when the LGP began operating.

Compare these figures to the World Gold Council's estimate of U. S. gold reserves.
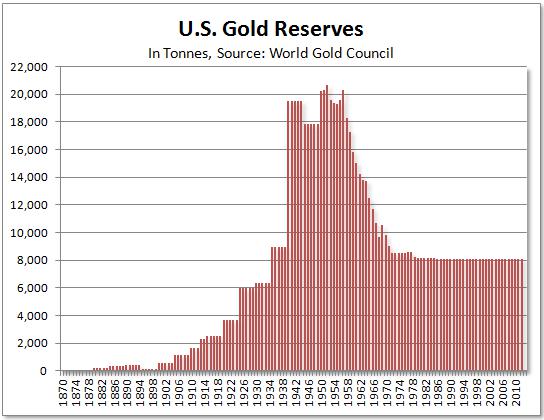
We see that from the 1934 price fix of $35/ounce for gold to shortly after the Bretton Woods agreement gold reserves and money supply rose more or less together, although money supply rose at a faster rate. But starting in the mid 1950s we begin to see America's gold supply decline quite rapidly, and this is the case because holders of dollars, who were legally able to exchange their dollars for gold, began to do so. With gold reserves falling and money supply rising it became obvious to anybody who was paying attention that the Bretton Woods monetary system was unsustainable unless the dynamic changed.
B: The Need For the London Gold Pool
As the supply of dollars continued to rise while the amount of gold backing this supply began to fall it is only natural that the $35/ounce peg would come under pressure--basic supply and demand economic fundamentals dictate that the price of gold had to rise so that the amount of dollars in circulation reflected America's gold stock. While the U.S. could continue exchanging its gold for dollars for some time, as the above chart illustrates the American gold stock was rapidly depleted: e.g. about a third was depleted from 1955 through 1960.
In late 1960 there was a spike in the price of gold: the following chart, which shows the London Fix price from 1954 - 1968, has the price peaking at $38/ounce in October of 1960, but the price actually exceeded $40/ounce briefly.
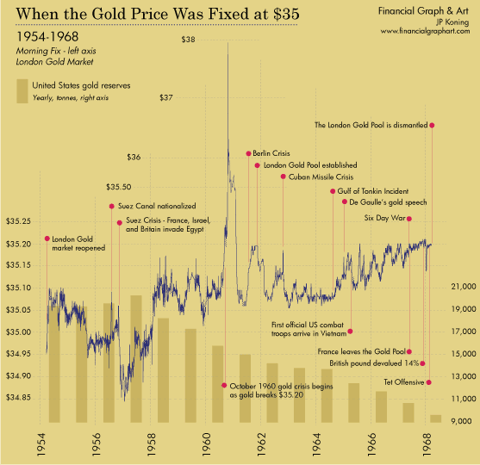
This price spike lead to Central Banks deciding that they secretly needed to suppress the price of gold in order to maintain the Bretton Woods system.
Specifics in the matter are given by Charles A. Coombs of the Federal Reserve in his article Treasury and Federal Reserve Foreign Exchange Operations and the Gold Pool found in the New York Federal Reserves Monthly Review for March, 1964 (pp. 47-56, especially pp. 53-56).
By the end of August 1961, the London market price had risen once more to nearly $35.20 and held close to this level until mid-November. As the price approached $35.20, European central banks refrained from market purchases since London gold at these prices exceeded the shipping parity from New York. While this withdrawal of central bank demand brought the market into better balance, there remained the risk that a sudden upsurge of speculative demand might confront the British and United States financial authorities with an unpleasant dilemma: If, on the one hand, the free market price were allowed to rise, there was a clear risk that speculation might feed upon itself and result in a new wave of apprehension such as occurred in October 1960. If, on the other hand, the full brunt of a speculative attack were to be absorbed by drafts upon the United States gold reserves, the subsequent weekly publication of such United States gold losses might also have unsettling consequences.
In view of the mutuality of interest among the central banks and treasuries on both sides of the Atlantic in maintaining orderly conditions in the gold and exchange markets, the United States financial authorities approached the BIS group of central banks in October 1961 with a proposal to establish on an informal basis a central bank selling arrangement which would share the burden of intervention on the London gold market to keep the price within bounds.
In other words the $35/ounce fixed price was in jeopardy, and so a group of central banks, who saw this price parity to be in their best interest, decided to come together in order to maintain it. This shows intent to manipulate the gold price on the part of the Federal Reserve and its coevals. In what follows I will make it clear that this intent was followed by market action, thus proving manipulation as I have defined it.
B: The London Gold Pool From 1961 - 1965
In November, 1961 8 central banks pooled gold resources together in agreed upon portions in order to sell it into the market whenever the price climbed too high. The participant nations included:
- United States, 50%, 120 tonnes ($135 Million)
- Germany, 11%, 27 tonnes ($30 Million)
- United Kingdom, 9%, 22 tonnes ($25 Million)
- France, 9%, 22 tonnes ($25 Million)
- Italy, 9%, 22 tonnes ($25 Million)
- Belgium, 4%, 9 tonnes($10 Million)
- Netherlands, 4%, 9 tonnes ($10 Million)
- Switzerland, 4%, 9 tonnes ($10 Million)
While 240 tonnes of gold doesn't seem to be a lot (recall that the U.S. had roughly 15,000 tonnes in 1961 according to the above chart, and that figure exceeded 20,000 tonnes in the late 1940s) the pool was set up not just to sell gold into the market when prices got too high (generally above $35.20), but to buy when the price went back down. According to Coombs the LGP participants would come together monthly to discuss how to act in the gold market on a monthly basis. Coombs catalogs the LGP's buying and selling in the early years of the operation:
- November, 1961: The LGP first operates by selling gold into the market. It lets up in December when upward price pressure was relieved.
- February and April, 1962: A surplus of gold builds up in the market and the LGP enters on the buy side of the market.
- May - July, 1962: Market conditions reverse and the gold that was accumulated in the previous months is distributed into the market.
- October, 1962: The Cuban missile crisis creates demand for gold, which is stymied by the LGP.
- November, 1962 through 1963: Buying pressure in the gold market subsides as private hoarders became less interested, and as the Soviets sold gold in order to buy wheat. Throughout this period the LGP accumulates gold.
From Coombs' article we can deduce that at first the LGP didn't simply suppress prices when demand was high, but it was able to thrive and trade profitably around the small price fluctuations in the market. In fact the LGP was profitable: the value of its holdings rose from $270 million in 1961 to $1.5 billion in 1965.
However it was becoming more and more obvious that the United States would be unable to honor its promises to exchange an ounce of gold for just $35. This was the case even before the LGP was formed, and the unsustainability of the $35/ounce peg rate was in fact the reason that the LGP was set up. But the problem of the U.S. money supply getting too big was increasing. The following shows the M2 money supply from November 1st, 1961 (the commencement of the LGP), through 1965. We saw a rise from $334 billion to $467 billion, or 40% (9% annualized)

We see a similar chart looking at MZM, which rose from $319.3 billion to $429.5 billion during the same time-frame, which is a 34.5% increase.

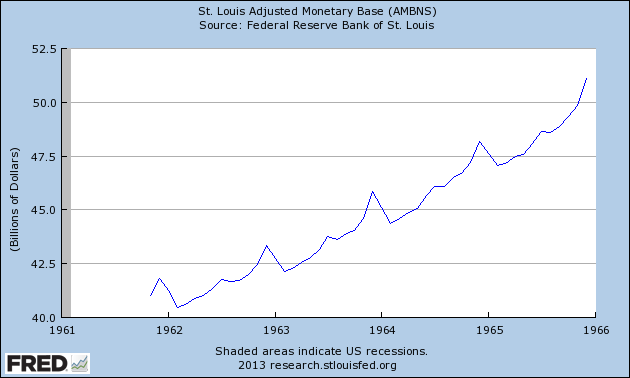
Even the monetary base grew nearly 25% from $41 billion to $51 billion.
But this data doesn't imply that the price of gold should have risen by 24%, 35%, or 40% during the first years of the LGP: this increase was happening as the United States was still honoring its promises to exchange an ounce of gold for $35. The United States' gold supply was shrinking, meaning that if dollars were convertible to gold by foreigners, then the number of dollars needed to redeem an ounce of gold should have risen faster than the money supply.
So as successful as the LGP manipulation was at the beginning the imbalance that it was meant to conceal was becoming more acute. This was becoming more apparent to those in a position to take possession of American gold, perhaps most famously French President Charles de Gaulle, who called for a gold standard and argued that there would be a monetary crisis in 1965.
C: The London Gold Pool From 1965 - 1968 and the 1968 Gold Crisis
De Gaulle's statement more or less coincided with the peak of success for the LGP, which began to see outflows soon afterward. In 1967 the dissolution of the LGP began.
France exited in June, indicating that the effort was hopeless. In November the second most important currency to the Bretton Woods system--Pound Sterling--was devalued by 14%. This lead to panic in the gold market and massive outflows from the LGP. This issue was addressed directly in the Federal Reserve's December minutes. While it was suggested that gold certificates could be sold into the market as a substitute for the real thing, but this was not a solution.
In March of 1968 the LGP collapsed and the gold market was closed for several weeks. Other measures were used to control the gold market and to maintain the $35/ounce parity. The U.S. government attempted to strong-arm South Africa into selling its gold into only the London market in order to cap prices there. However this failed, as the following chart illustrates.
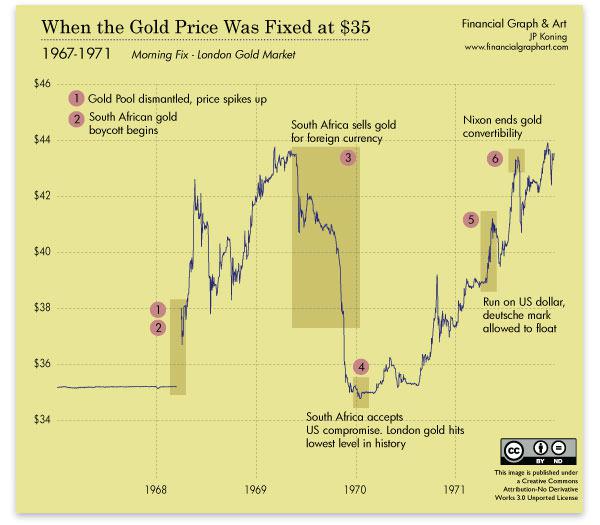
By 1971 the illusion of the $35/ounce parity lost all standing and by August of that year Nixon defaulted on this parity in order to preserve what little gold the United States had left. The next several years saw an incredible bull market in the gold price, which increased in value more than 20-times. Of course gold did not become 20 times more valuable over the 1970s--the price was making up for increases that should have taken place in the period following World War 2 up until the price was allowed to float freely.
Conclusion
The LGP is an excellent example of market manipulation. We can see how a consortium with a common interest came together in order to fight market forces. Further we can see how successful this consortium was for such a long period of time. Nevertheless even a group of eight of the world's most powerful central banks couldn't overcome market forces.
In my follow-up it will become clear that something similar is happening today, and it has even been referred to as the New York Gold Pool. There are central banks throughout the world who have a vested interest in seeing the price of gold low, or at least stable. Furthermore, despite an enormous rise in the money supply of the U. S. Dollar and other currencies, and despite the soaring cost of producing gold, the price of gold has been rather subdued. While this can go on for quite some time it is not a permanent state of affairs.
0 comments:
Publicar un comentario